Article Text

Abstract
Study objective: To analyse the associations between proxies of healthcare need and GP practice prescribing rates for five major coronary heart disease (CHD) drug groups.
Design: Cross sectional secondary analysis.
Setting: Four primary care trusts (PCTs 1–4) in the north west of England, encompassing 132 GP practices.
Results: Prescribing rates were generally positively associated with the percentage of patients aged 55–74 years and PASS-PUs (regionally specific prevalence, age, and sex standardised prescribing units). However, the percentage of patients aged over 75 years showed a lack of association with prescribing rates in all PCTs other than PCT2. Correlations with the proportion of South Asian patients were generally negative, particularly in PCT2, PCT4, and the combined dataset. There was a general lack of association with deprivation proxies and SMRs for CHD, although there were negative associations with both variables in PCT4 and the combined dataset. Scatter plots showed that GP practices with similar prescribing rates had widely differing levels of comparative healthcare need, and GP practices with similar levels of healthcare need had widely differing prescribing rates.
Conclusion: GP prescribing rates in some PCTs were negatively associated with proxies of healthcare need based on patient age (patients aged over 75 years), ethnicity, levels of deprivation, and SMRs for CHD. As such, this study suggests that prescribing rates in these PCTs may be inequitable as they are not positively associated with healthcare need. This study may form the baseline for further studies to assess the effectiveness of the NSF for CHD in reducing the inequities in prescribing rates.
- coronary heart disease
- equity
- GP prescribing
- CHD, coronary heart disease
- PCT, primary care trust
- NSF for CHD, National Service Framework for coronary heart disease
- ADQ, average daily quantity
- HCNI, health care needs indicator
- LISI, low income scheme index
- PASS-PU, prevalence, age and sex specific prescribing unit
Statistics from Altmetric.com
- CHD, coronary heart disease
- PCT, primary care trust
- NSF for CHD, National Service Framework for coronary heart disease
- ADQ, average daily quantity
- HCNI, health care needs indicator
- LISI, low income scheme index
- PASS-PU, prevalence, age and sex specific prescribing unit
The National Service Framework for coronary heart disease (NSF for CHD) highlights variations in the quality and access to coronary heart disease (CHD) services in the UK and proposes mechanisms to tackle these variations.1 To assess the effectiveness of the NSF, we firstly need baseline data on quality and equity of CHD services. While a number of studies have highlighted variations in the access to, and provision of CHD hospital interventions on the basis of patient age,23 gender,2–6 ethnicity,478 and socioeconomic status,248–12 there has been little research on the equity of CHD prescribing. The aim of this paper is to analyse the equity of GP practice prescribing rates for drugs for the prevention of CHD that were recommended in the respective NSF.1
Comparative healthcare need (akin to the concept of equity), which is one of the domains in the “taxonomy of need”,1314 is used as the conceptual framework in this paper. Analysis of comparative health care need would assume that GP practices or primary care trusts (PCTs) with comparatively higher levels of healthcare need would also have comparatively higher prescribing rates. Similarly, those with comparatively higher prescribing rates would also have comparatively higher levels of healthcare need. However, there is a growing body of research that has highlighted large variations in overall prescribing rates between GP practices, which are only partially explained by factors other than healthcare need.15–19
Prescribing of statins has increased significantly in recent years,20–22 although the use of statins in patients with a history of CHD remains well below recommended levels.2023 Statin prescribing has been shown to vary between health authorities and GPs21222425 and between patients on the basis of gender, demographics, and deprivation.6202526
Prescribing rates have been found to be lower in patients aged over 75 years for statins232527 and β blockers.2829 Prescribing rates of statins are positively associated with GP diagnoses of CHD25 and with expected rates of CHD prevalence.26 In another study, those people with a more recent date of diagnosis of CHD had a better chance of receiving a statin.30
Prescribing rates of lipid lowering drugs were found to be lower for South Asian patients than for white patients31 and two separate studies of people with diagnosed CHD found that non-white ethnic minority patients were less likely to be prescribed a β blocker than white patients.2829
One study found that prescribing rates of all cardiovascular drugs were positively correlated with levels of deprivation,26 although others found that prescribing rates of statins and lipid lowering drugs were negatively correlated with deprivation.2631 However, other studies found that statin prescribing rates were not associated with levels of deprivation213233 although this may imply an inverse care law as prescribing rates ought to have been higher in more deprived areas because of higher levels of CHD.3435
Overall, research studies suggest that statin prescribing is lower in patients over 75 years, in more deprived areas, and in areas with higher proportions of South Asian patients. The purpose of this paper is to explore the equity of prescribing for a range of CHD drug groups using a more valid measure of prescribing volume (average daily quantities). In addition, the data on which this paper is based will enable a longitudinal analysis of the effectiveness of the introduction of PCTs and the NSF for CHD on the equitable prescribing of CHD drugs.
SETTING
The study was undertaken in four contiguous urban PCTs in the north west of England (called PCT1, PCT2, PCT3, and PCT4 throughout this paper). PCTs 1–3 all have greater deprivation and ethnic diversity than the national average whereas PCT4 is demographically similar to England and Wales. As shall be shown, all the PCTs had marked variations of ethnicity and socioeconomic status within them. GP practices with fewer than 1000 registered patients were excluded from analysis. After excluding these practices, PCT1 had 50 GP practices, PCT2 had 24, PCT3 had 31, and PCT4 had 27.
METHODS
This section focuses on the data sources and methods used to develop prescribing rates and proxies for healthcare need (called healthcare needs indicators (HCNIs) in this paper), which were developed for each GP practice in the four PCTs.
Developing prescribing rates
Prescribing analysis and cost (PACT) data were obtained for all GP practices in the four PCTs for the 12 month period October 1999 to September 2000. These data were collected for a number of drugs used for the prevention of CHD (a full list of drugs obtained are listed in the appendix), which are presented as five drugs and/or drug groups: statins, ACE-inhibitors, β blockers, aspirin, and bendrofluazide. In addition, a category called “all study CHD drugs” was created by summing data for the individual drugs used in this study.
The numerator in all prescribing rates was based on a measure of prescription volume, as opposed to prescription cost. The validity of using the number of prescription items or total cost as a measure of prescribing volume has been called into question3637 as it does not specify the quantity of prescription drug (for example, number and/or dose of tablets). Therefore, a measure of prescription volume that calculates the total number of grams prescribed is much more useful. Within this study, total average daily quantities (ADQs)38–40 were used as the unit of analysis, which represent “analytical units produced in order to compare more accurately the prescribing activity of primary care prescribers”.40
The denominator in prescribing rates was the total registered patient population aged over 35 years. These data were obtained from GP practice registered lists. This age group was chosen as the prevalence of CHD is particularly low in people aged less than 35 years.41 Across the four PCTs, there were over 350 000 registered patients aged over 35 years, although this differed from around 60 000 in PCT4 to almost 150 000 in PCT1. The prescribing rate used in this study was total ADQs prescribed per patient aged over 35 years.
Developing healthcare needs indicators (HCNIs)
In total, 26 HCNIs were developed for each GP practice in this study, although a limited number are presented here to represent patient demographics, ethnicity, deprivation, CHD mortality, and expected levels of treated CHD. Demographic HCNIs were developed directly from GP practice list data, and these relate to the percentage of patients aged 55–74 years, and the percentage aged over 75 years. Both of these demographic groups are indicators of healthcare need for CHD drugs.41
The method of patient weighted attribution was used to develop HCNIs from data originally available for either enumeration districts or electoral wards. Critiques of this method are available elsewhere.42–44 This method was used with data from the 1991 census (at ED level) to calculate the expected percentage of patients from South Asian populations (that is, India, Bangladesh, and Pakistan). ED level data were also used to calculate the Townsend score45 of each GP practice. Electoral ward level data on SMRs for CHD (under 75 years) were used to calculate the expected SMR for each GP practice. The low income scheme index (LISI) was also used as a proxy for poverty because it represents the percentage of registered patients who are exempt from prescription charges because of low income.46
A separate proxy for CHD morbidity was also developed (regionally specific prevalence, age, and sex specific prescribing units or PASS-PUs) that represents the expected prevalence of CHD in each GP practice, based on age and sex of registered patients.47 PASS-PUs were developed using data from the General Practice Research Database on the age-sex rates of treated CHD in the North West region.48 These rates were then applied to the age-sex strata in each GP practice, in order to calculate an expected rate of treated CHD.
RESULTS
This section focuses on associations between prescribing rates for the different CHD drug groups and selected HCNIs developed during this study. Prescribing rates are based on total ADQs per patient over 35 years, and associations are based on Spearman’s rank correlations. Correlation coefficients for associations between prescribing rates for each CHD drug group and selected HCNIs are presented in tables 1 to 7.
Correlation coefficients for associations between prescribing rates for CHD drug groups and proportion of South Asian patients
In terms of patient ethnicity (see table 1), there were negative, statistically significant correlations between most prescribing rates and the percentage of South Asian patients in PCT2 and the combined dataset. For example, statin prescribing rates had a correlation coefficient of −0.504 (p<0.05) in PCT2 and −0.435 (p<0.01) in the combined dataset. In PCT1 and PCT3, although all correlations were negative, the only statistically significant association was a low, negative correlation with all CHD prescribing in PCT1.
The percentage of patients aged 55–74 years was positively, and statistically significantly, associated with all prescribing rates in the combined dataset (see table 2). The highest coefficients were generally in PCT4, although in PCT1, the only statistically significant association was with aspirin prescribing. The only statistically significant association with statin prescribing was in PCT2, and with ACE inhibitors is PCT4.
Correlation coefficients for associations between prescribing rates for CHD drug groups and proportion of patients aged 55–74 years
The percentage of patients aged over 75 years was generally only statistically significantly associated with prescribing rates in PCT2 (see table 3). However, there were statistically significant associations with aspirin in PCT1, and with bendrofluazide in PCT3. In the combined dataset, prescribing rates for aspirin (0.341, p<0.01) and β blockers (0.176, p<0.05) were significantly associated with the proportion of patients aged over 75 years.
Correlation coefficients for associations between prescribing rates for CHD drug groups and proportion of patients aged over75 years
In figure 1, GP practices in PCT1 tend to have the highest proportions of patients in this age group and the highest prescribing rates (although the association is not statistically significant). However, the other PCTs tend to reveal a positive relation, suggesting that prescribing rates increase in GP practices with higher proportions of patients aged 55–74 years. In figure 2, GP practices in PCT4 had higher percentages of patients aged over 75 years than GP practices in the other PCTs. Therefore, although the correlation coefficients suggest similar associations (or lack of associations), the scatter plot shows the very different nature of the associations between PCTs. A comparative needs based approach may suggest that CHD related healthcare need in PCT4 is much higher than the other PCTs based on this demographic variable, although prescribing rates in PCT4 are not generally higher than the other PCTs. Therefore, this suggests a mis-match between prescribing rates and this demographic HCNI between the PCTs. In addition, mis-matches can be seen within PCTs, whereby some GP practices have higher prescribing rates, but lower proportions of patients aged over 75 years than other GP practices in the same PCT.
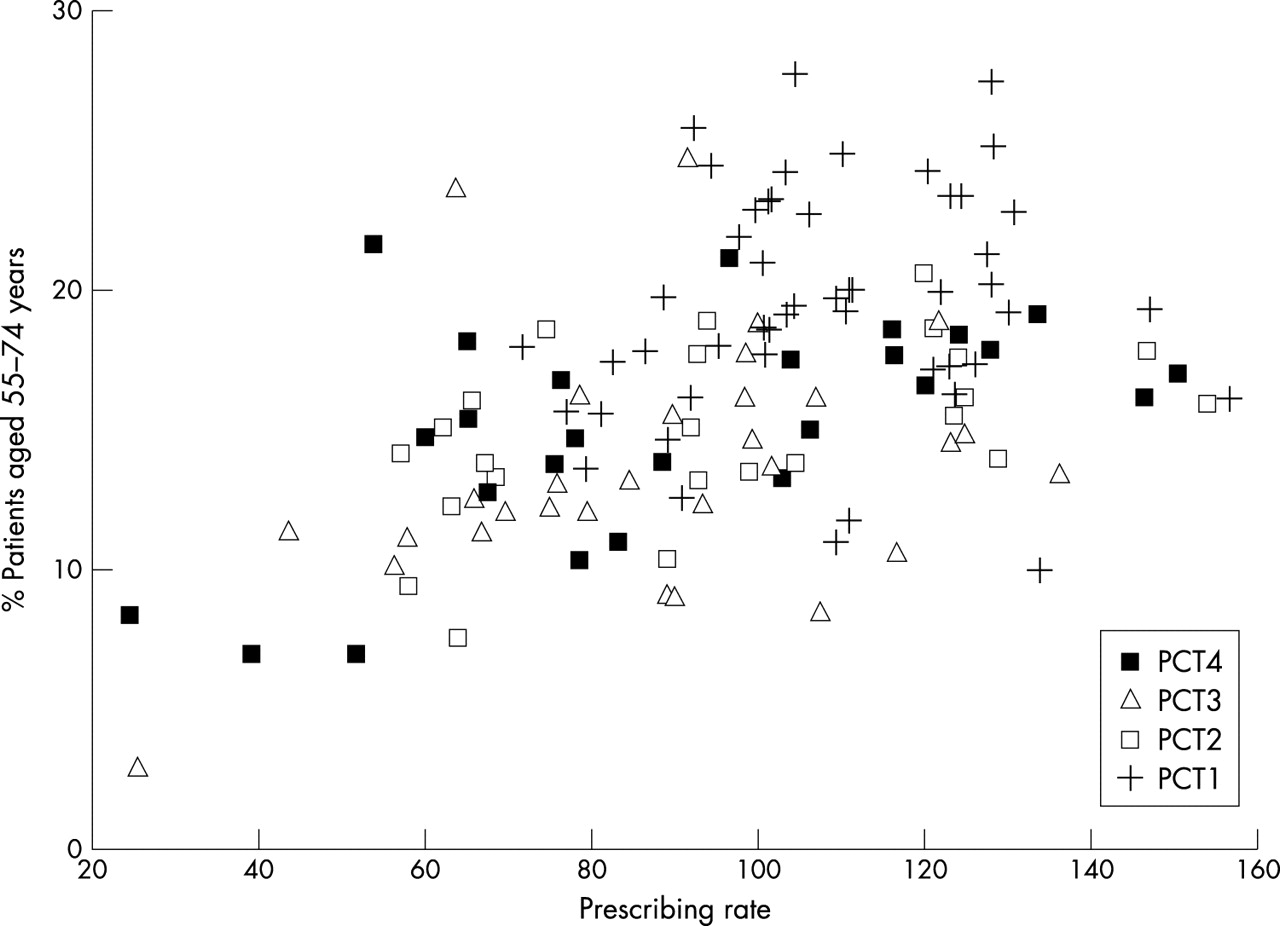
Prescribing rates for combined CHD drugs with the percentage of patients aged 55–74 years.

Prescribing rates for all CHD drugs with the percentage of patients aged over 75 years.
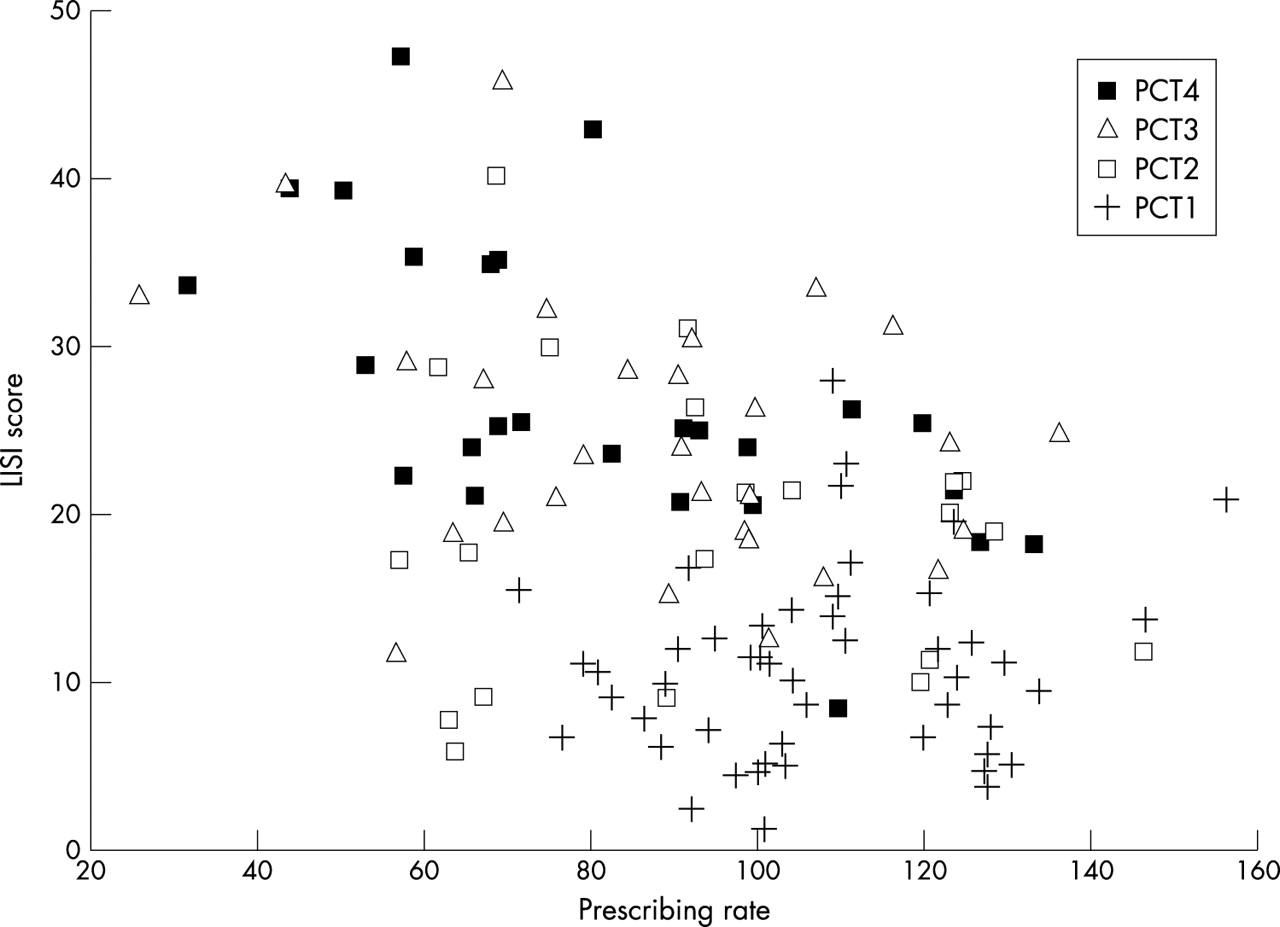
In the overall dataset, there were statistically significant (negative) associations between both indicators of deprivation and prescribing rates for statins, ACE inhibitors, bendrofluazide, and all CHD drugs combined (see tables 4 and 5). With the LISI score, there were statistically significant negative correlations for all drug groups except bendrofluazide in PCT4, although correlations in other PCTs were not statistically significant. In PCT1, PCT2, and PCT3, associations between prescribing rates and both indicators of deprivation were small, and generally not statistically significant. The Townsend score was negatively associated with prescribing rates in PCT4 for aspirin, ACE inhibitors, and all CHD drugs, and with all drugs except aspirin and β blockers in the combined dataset. Correlation coefficients in PCT4 were higher with the LISI score than the Townsend score (−0.478 v −0.242 for statins, and −0.651 v −0.403 for aspirin).
Correlation coefficients for associations between prescribing rates for CHD drug groups and Townsend Score
Correlation coefficients for associations between prescribing rates for CHD drug groups and the LISI score
Key points
-
This study explored the relation between healthcare need and GP prescribing rates for coronary heart disease (CHD) drugs in 132 GP practice populations, which form four primary care trusts (PCTs).
-
Analysis on the basis of PCTs revealed some negative associations with healthcare need on the basis of patient age (over 75 years), ethnicity, levels of deprivation, and SMRs for CHD.
-
Analysis on the basis of individual GP practices showed a mis-match between GP practice prescribing rates and comparative healthcare need, whereby some GP practices with high prescribing rates had lower than expected levels of healthcare need, and other GP practices with low prescribing rates had higher than expected levels of healthcare need.
-
Therefore, GP prescribing rates for CHD drugs seem inequitable on the basis of this study.
The association between the LISI score and prescribing rates for all CHD drugs is presented in figure 3. GP practices in PCT4 tend to have much higher levels of deprivation than GP practices in PCT1, and as such, would be expected to have higher prescribing rates using a comparative needs based approach. However, prescribing rates in PCT4 are lower than those in PCT1, suggesting a potential mis-match between prescribing rates and deprivation. However, it must be remembered that deprivation alone is not a risk factor for CHD need, and therefore these figures cannot be used to infer inequitable prescribing.

Prescribing rates for all CHD drugs with the LISI score.
With respect to PASS-PUs (see table 6), PCT2 had comparatively high, positive and significant coefficients (between 0.5 and 0.6) for all drug groups, except bendrofluazide and β blockers. PCT1 had positive, statistically significant correlations with prescribing rates for aspirin and for all CHD drugs combined, and PCT3 had positive, statistically significant correlations with prescribing rates for β blockers, bendrofluazide, and all CHD drugs combined. Therefore, expected rates of treated CHD were positively associated with prescribing rates for specific drug groups in all PCTs other than PCT4.
Correlation coefficients for associations between prescribing rates for CHD drug groups and PASS-PUs
There were no statistically significant associations between any of the prescribing rates and SMRs (see table 7), in either PCT2 or PCT3, and the only statistically significant association in PCT1 was with bendrofluazide, although this association was negative. PCT4 had relatively high (between −0.4 and −0.6), negative and statistically significant associations between SMRs and all drugs groups, except bendrofluazide. When all GP practices are combined, statistically significant, negative associations were found between SMRs and all drug groups except aspirin and β blockers.
Correlation coefficients for associations between prescribing rates for CHD drug groups and the SMR for CHD
Figure 4 presents a scatter plot showing the negative associations for PCT4 and also for the whole dataset combined. GP practices in PCT1 generally had the lowest SMRs compared with the other PCTs, but their prescribing rates were not low in comparison. If you draw a vertical line at around 70 ADQs per patient, all of the GP practices to the left of the line (and thus have lower prescribing rates) are in PCTs 2, 3, and 4, although these GP practices have higher SMRs than GP practices in PCT1. However, there are large variations even within PCT1. For example, there are a number of GP practices in PCT1 with prescribing rates around 100 ADQs per patient, although the SMRs in these GP practices ranges from around 65 to almost 170. However, as these GP practices had similar prescribing rates, it might be expected that they would have similar SMRs. Therefore, there seems to be a mis-match between prescribing rates and SMRs between PCTs, and also within PCTs. Indeed, the mis-match is most apparent between one GP practice in PCT3 that has an SMR of around 180 and a prescribing rate of almost 30 ADQs per patient, and another GP practice in PCT1 that also has an SMR of around 180, although the prescribing rate is almost 160 ADQs per patient. Therefore, both GP practices have similar SMRs, but one has a prescribing rate over five times higher than the other.

Prescribing rates for all CHD drugs with SMRs for CHD.
DISCUSSION
In general, prescribing rates were positively associated with the percentage of patients aged 55–74 years although the percentage of patients aged over 75 years showed a lack of association with prescribing rates in all PCTs other than PCT2, where it had comparatively high correlations with prescribing rates for almost all drug groups. While this does not confirm findings of inequitable prescribing on the basis of age,23252728 it does suggest a fruitful area for further research. This study also found generally negative associations between prescribing rates and the proportion of South Asian patients, particularly in PCT2 and PCT4, in addition to the combined dataset, which confirms findings by others.282931
There was a general lack of association between prescribing rates and deprivation proxies, although there were negative associations in PCT4 and in the combined dataset. The negative associations in PCT4 and the combined dataset suggest possible inequitable prescribing patterns, although in the lack of association in the other PCTs confirm findings by others.213233 Nevertheless, given the socioeconomic gradient in CHD343549 it might be expected that prescribing of CHD drugs would be higher in GP practices in more deprived areas. Therefore, the lack of association may be indicative of inequitable prescribing, although further research in these areas needs to be undertaken before such conclusions can be made.
Negative associations were also found between prescribing rates and SMRs in PCT4 and the combined dataset, although there were no associations with SMRs in the other PCTs. Prescribing rates were generally positively associated with PASS-PUs although there was no association in PCT4. The generally positive association with rates of treated CHD was similar to that found using indicative prevalences26 and diagnosed CHD.25 This also suggests that expected rates of treated CHD are better than SMRs as indicators of healthcare need, although it is recognised that PASS-PUs do not account for patients who remain undiagnosed.
In addition to the correlations presented in this paper, there were a number of scatter plots that revealed mis-matches between prescribing rates and HCNIs. Firstly, it was generally the case that GP practices in PCT1 had higher prescribing rates and lower levels of comparative healthcare need than GP practices in other PCTs, and particularly those in PCT4. In addition, the scatter plots also revealed mis-matches in prescribing rates between individual GP practices, both within and between PCTs. GP practices with similar prescribing rates were found to have widely differing levels of comparative healthcare need, and GP practices with similar levels of healthcare need had widely differing prescribing rates. Therefore, it seems from this comparative needs based analysis, that there is a mis-match between prescribing rates and a number of HCNIs.
Overall, this study has explored the associations between HCNIs and prescribing rates for CHD drugs. Differences have been found between PCTs and between CHD drugs, although the main point is that GP prescribing rates seem to be inequitable on the basis of patient age (patients aged over 75 years) and ethnicity, levels of deprivation and SMRs for CHD. Indeed, the NSF for CHD recognised that “many people with CHD are not receiving treatments of proven effectiveness” and there are “unjustifiable variations in the quality and access to some CHD services”.1 This study adds weight to these assertions and may form the baseline for further studies to assess the effectiveness of the NSF for CHD in reducing the inequities in prescribing rates.
Policy implications
-
The National Service Framework for coronary heart disease (NSF for CHD) has highlighted variations in the quality and access to CHD services in the UK. However, the equity of CHD services such as GP prescribing rates has been a neglected area of research.
-
This study adds weight to the assertions of the NSF about the inequitable supply of CHD services and may form the baseline for further studies to assess the effectiveness of the NSF for CHD in reducing the inequities in prescribing rates.
Appendix
LIST OF DRUGS USED IN THIS STUDY
-
Aspirin (75 mg)
-
Bendrofluazide (2.5 mg)
-
Statins (Atorvastatin, Cerivastatin, Fluvastatin, Pravastatin, Simvastatin)
-
ACE inhibitors* (Captopril, Enalapril, Lisinopril, Ramipril, Trandolapril)
Acknowledgments
We thank all health authority staff who provided access to both PACT data and data on GP practice lists.
REFERENCES
Footnotes
-
↵* The five ACE inhibitors represent the majority of prescribing for all ACE inhibitors.
-
↵† Atenolol represents the majority of prescribing of all β blockers.
-
↵‡ Co-tenidone is a combination product containing both a β blocker (atenolol) and a diuretic (chlorthalidone).
-
Funding: Paul Ward received a Health Services Research Training Fellowship from the North West NHS Executive to carry out the study on which this paper is based.
-
Conflicts of interest: none declared.