Antibiotic treatment failure in four common infections in UK primary care 1991-2012: longitudinal analysis
BMJ 2014; 349 doi: https://doi.org/10.1136/bmj.g5493 (Published 23 September 2014) Cite this as: BMJ 2014;349:g5493
- Craig J Currie, professor12,
- Ellen Berni, scientific officer2,
- Sara Jenkins-Jones, research fellow2,
- Chris D Poole, senior research associate1,
- Mario Ouwens, principal statistician3,
- Stefan Driessen, head, biometrics3,
- Hanka de Voogd, head, therapeutic area3,
- Christopher C Butler, professor14,
- Christopher Ll Morgan, epidemiologist2
- 1Cochrane Institute of Primary Care and Public Health, Cardiff University, Cardiff, UK
- 2Global Epidemiology, Pharmatelligence, Cardiff, UK
- 3Established Pharmaceuticals, Abbott Healthcare Products, Weesp, Netherlands
- 4Nuffield Department of Primary Care Health Sciences, University of Oxford, Oxford, UK
- Correspondence to: C J Currie currie{at}cardiff.ac.uk
- Accepted 27 August 2014
Abstract
Objective To characterise failure of antibiotic treatment in primary care in the United Kingdom in four common infection classes from 1991 to 2012.
Design Longitudinal analysis of failure rates for first line antibiotic monotherapies associated with diagnoses for upper and lower respiratory tract infections, skin and soft tissue infections, and acute otitis media.
Setting Routine primary care data from the UK Clinical Practice Research Datalink (CPRD).
Main outcome measures Adjusted rates of treatment failure defined by standardised criteria and indexed to year 1 (1991=100).
Results From 58 million antibiotic prescriptions in CPRD, we analysed 10 967 607 monotherapy episodes for the four indications: 4 236 574 (38.6%) for upper respiratory tract infections; 3 148 947 (28.7%) for lower respiratory tract infections; 2 568 230 (23.4%) for skin and soft tissue infections; and 1 013 856 (9.2%) for acute otitis media. In 1991, the overall failure rate was 13.9% (12.0% for upper respiratory tract infections; 16.9% for lower respiratory tract infections; 12.8% for skin and soft tissue infections; and 13.9% for acute otitis media). By 2012, the overall failure rate was 15.4%, representing an increase of 12% compared with 1991 (adjusted value indexed to first year (1991) 112, 95% confidence interval 112 to 113). The highest rate was seen in lower respiratory tract infections (135, 134 to 136). While failure rates were below 20% for most commonly prescribed antibiotics (amoxicillin, phenoxymethylpenicillin (penicillin-V), and flucloxacillin), notable increases were seen for trimethoprim in the treatment of upper respiratory tract infections (from 29.2% in 1991-95 to 70.1% in 2008-12) and for ciprofloxacin (from 22.3% in 1991-95 to 30.8% in 2008-12) and cefalexin (from 22.0% in 1991-95 to 30.8% in 2008-12) in the treatment of lower respiratory tract infections. Failure rates for broad spectrum penicillins, macrolides, and flucloxacillin remained largely stable.
Conclusions From 1991 to 2012, more than one in 10 first line antibiotic monotherapies for the selected infections were associated with treatment failure. Overall failure rates increased by 12% over this period, with most of the increase occurring in more recent years, when antibiotic prescribing in primary care plateaued and then increased.
Introduction
Microbial resistance to antibiotics has increased alarmingly over recent decades, prompting the World Health Organization to declare this a global public health crisis.1 The previous 20 years have witnessed a sharp increase in strains resistant to β lactams,2 and the same is true of other antimicrobial drugs such as the quinolones and even of antibiotics of last resort such as the carbapenems. Recent antibiotic use in primary care is the single most important risk factor for an infection with a resistant organism.3 Primary care clinicians, however, seldom report problems associated with antibiotic resistance in their own practice and regard the problem as often outside their control.4 Both primary care clinicians and members of the public typically regard antibiotic resistance as a problem that largely affects patients in hospital.4 5
There is a need to better characterise and understand the epidemiology and impact of antibiotic treatment failure—which might be representative of antibiotic resistance—over time in the primary care setting. This is not simple because of the large number of antibiotic drugs available; differing infection types and microbial characteristics; and the difficulty in interpreting adverse outcome signals in population data, which might, over time, vary according to changes in host, antibiotic, and pathogen factors.6 Using a large routine primary care data source, we assessed the failure of first line (initial) antibiotic regimens in the United Kingdom from 1991 to 2012, alongside an analysis of background antibiotic prescription patterns. The UK is one of the few countries where there are appropriate data to do so, largely because of the nature of its National Health Service (NHS) and the attendant continuity of data recording. We expected to find an increase in treatment failure rates for all commonly used antibiotics, as previously reported elsewhere.7
One of the motives for this study relates to the macrolide antibiotic clarithromycin, which was introduced internationally 25 years ago (1991 in the UK). This anniversary provided an opportunity to assess overall antibiotic practice and effectiveness over time for four common classes of infections for which clarithromycin is used: upper and lower respiratory tract infections, skin and soft tissue infections, and acute otitis media.
Methods
Data source
We used data from the Clinical Practice Research Datalink (CPRD), a longitudinal anonymised research database derived from nearly 700 primary care practices in the UK.8
The database currently contains clinical records from over 14 million individuals. The computerised data, recorded in the course of routine healthcare by general practitioners and associated staff, include demographic and lifestyle information, drug prescriptions, medical history, test results, and hospital referrals. Diagnoses are recorded with the Read code classification, a UK general practice standard, and have been validated in several studies showing a high positive predictive value.9 Prescription data are well documented in the database, as they are generated within and automatically recorded by the GP’s practice software. Data in the CPRD, and its predecessor the General Practice Research Database, are broadly representative of the UK population in terms of age and sex.10 Contributing practices are spread geographically throughout the UK.
The CPRD organisation applies data quality markers at patient and general practice levels.11 Patients’ records are deemed to be of acceptable research quality if they are consistent with regard to age, sex, registration, and event dates and the patient has been permanently registered with the practice. Contributing practices are assessed for the completeness, plausibility, and continuity of their data and are assigned a date—the “up-to-standard” date—from which their data are judged to be of acceptable quality.
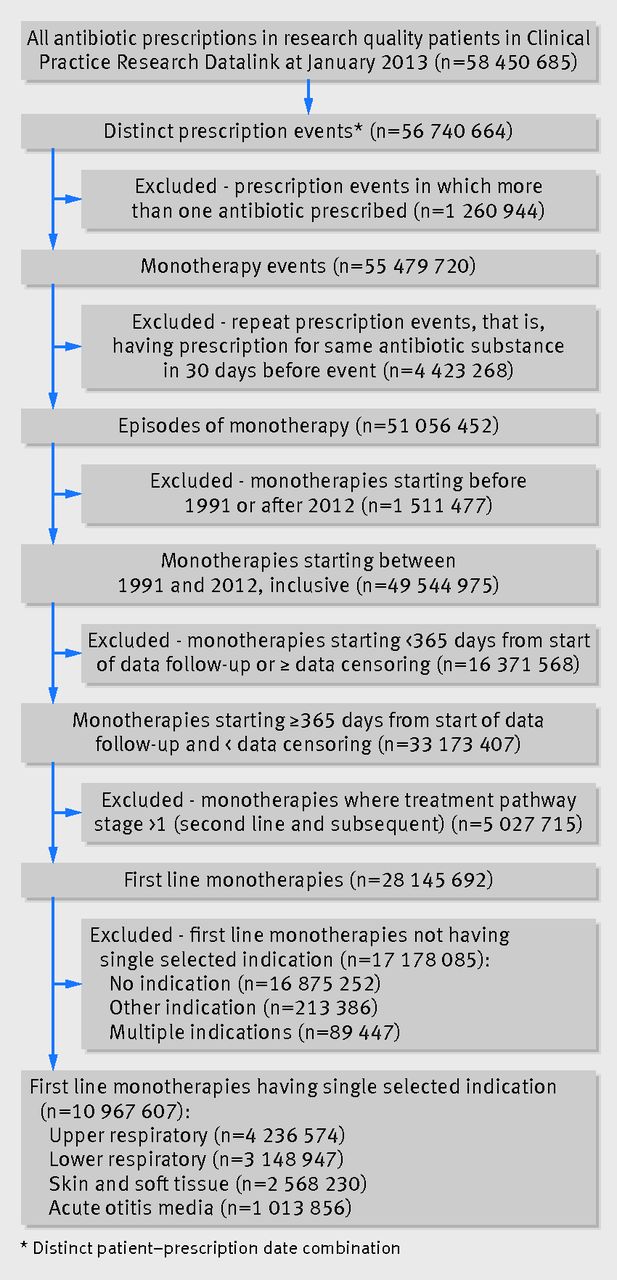
The number of clinical records and prescriptions added annually to the database increased more than fourfold from 1991 to 2012, while the number of registered patients doubled over the same period. Figure 1 illustrates the overall process of selecting study data.⇓.

Fig 1 Data flow diagram for selection of episodes of first line antibiotic monotherapy reported in Clinical Practice Research Datalink
Identification of antibiotic treatment
Prescriptions for antibiotic drugs were selected for the four infection classes. From these, we identified episodes of monotherapy, defined here as one or more consecutive prescriptions for a single antibiotic separated by no more than 30 days and uninterrupted by prescriptions for other antibiotic drug substances. Of all antibiotic prescriptions, 98% were monotherapy. Monotherapies were defined as first line if there were no prescriptions for other antibiotics in the preceding 30 days.
Monotherapy episodes were excluded if they were started before 1991 or after 2012 or if the interval from the later of the patient’s registration date or the practice’s up-to-standard date to initiation was less than 365 days.
Classification of infection
We selected diagnostic codes relating to the four infection classes: upper respiratory tract infections (for example, pharyngitis, laryngitis, tonsillitis, sinusitis), lower respiratory tract infections (for example, pneumonia, bronchitis, whooping cough), skin and soft tissue infections (for example, cellulitis, impetigo, abscesses), and acute otitis media. Monotherapies were selected if they had a single associated diagnosis (the nearest to treatment initiation) in one of these classes.
The index date was defined as the date of the first prescription in the monotherapy episode. More than one episode could be identified for any individual patient.
Infection rates and antibiotic prescription over time
In a separate procedure (not illustrated), we measured background infection rates over time for each infection class as the proportion of all GP consultations in which the GP recorded a diagnosis of that infection. Additionally, we determined the proportion of these infection related consultations in which an antibiotic was prescribed. This enabled us to assess the pattern of prescription over the research period and contextualise the treatment failure rates.
Study effectiveness endpoint—antibiotic treatment failure
As a proxy measure of effectiveness of treatment and, by implication, bacterial sensitivity, we evaluated the proportion of antibiotic courses resulting in treatment failure. While there is no consensus definition of such failure,12 several studies have defined it as the prescription of a different antibiotic within 30 days of the index date.13 14 15 Other data in the Clinical Practice Research Datalink, however, could also be indicative of unresolved infections. For this investigation, we therefore defined treatment failure as the earliest occurrence of any of: prescription of a different antibiotic drug within 30 days of the first line antibiotic; GP record of admission to hospital with an infection related diagnosis within 30 days of antibiotic initiation; GP referral to an infection related specialist service within 30 days of initiation; GP record of an emergency department visit within three days of initiation (the shorter time window being selected here to increase the probability that the emergency event was related to the infection); or GP record of death with an infection related diagnostic code within 30 days of initiation. We did not include reconsultation for an infection within the 30 day time window as a signifier of treatment failure because of the difficulty, within routine data, of distinguishing between a continuation of the original infection and the recording of that infection as a historic event. Within this primary care setting no information on in vitro microbiological resistance was available as a reason for switching antibiotic regimens.
Statistical analysis
For each year from 1991 to 2012, we determined antibiotic treatment failure rates for the four infection classes and overall. Because the numbers of patients and participating practices increased over the research period, we averaged overall treatment failure rates for each class over the first five year period (1991-95) to create a more stable baseline and compared them with the last five year period (2008-12), with χ2 to test the hypothesis of no change in rate.
Over the period, there were changes in population age and in the types of antibiotics used to treat each infection class and subclass (constituent diagnoses within each class). Therefore we also report antibiotic treatment failure rates as a standardised ratio (analogous to the standardised mortality rate) of observed to expected treatment failures for each year, indexed to the first year (1991=100), with 95% confidence intervals. To calculate these indexed failure rates, we constructed a matrix of four key strata (age, sex, antibiotic, and infection subclass) and applied the strata specific failure rates observed in 1991 to the corresponding denominator for each subsequent year and aggregated them to generate the expected number of treatment failures. The ratio of observed to expected treatment failures was then calculated. When necessary, we evaluated the probability of these changes being due to chance using the χ2 test; with this large volume of data, however, even small changes would be significant at the conventional level.
Initial data processing was undertaken with Microsoft SQL Server 2012. Statistical analysis was conducted with IBM SPSS Statistics 20.
Results
Patients and cases
The Clinical Practice Research Datalink contained records of 59 470 173 prescriptions for an antibiotic, issued to 8 146 697 patients. We excluded 1 019 488 prescriptions (1.7%) because they were not prescribed to patients with research quality records. Of the 331 775 patients (4.1%) accordingly removed from the study, 253 903 (76.5%) had records of unacceptable research quality because of their temporary registration status.
From the antibiotic prescriptions, 10 967 607 first line monotherapy episodes could be identified with a single indication within the selected infection classes: 4 236 574 for upper respiratory tract infections (38.6%); 3 148 947 for lower respiratory tract infections (28.7%); 2 568 230 for skin and soft tissue infections (23.4%); and 1 013 856 for acute otitis media (9.2%) (fig 1).⇑
Baseline characteristics
Table 1⇓ summarises relevant baseline characteristics, grouped by infection class and by early (1991-95) and late (2008-12) time periods. From the early to the late period, the number of patients in the study data set increased 2.6-fold, while the number of monotherapies increased 2.3-fold. The highest relative increase in patients and monotherapies was seen for skin and soft tissue infections. Mean age increased by 2 or 3 years across all infection classes, and the increase in mean BMI was about 3. The proportion of current smokers decreased over time in all groups, as did mean systolic and diastolic blood pressure.
Baseline characteristics by class of infection and time period. Figures are numbers (percentage) unless stated otherwise
As one might expect, patients treated for lower respiratory tract infections were the oldest: the mean age was 48.9 in the early period and 52.1 in the later period. They also formed the least healthy group, with the highest mean BMI (25.8 increasing to 28.3) and blood pressure (138.4/80.6 mm Hg decreasing to 131.7/76.6 mm Hg), and the most current smokers (26.7% decreasing to 23.3%) and users of corticosteroids and bronchodilators (doubling over time).
The mean age of patients treated for acute otitis media was surprisingly old, increasing from 15.6 in the early period to 18.4 in the late period (table 1).⇑
Consultation rates for selected infection classes
GP consultation rates for the four infection classes, with or without antibiotic treatment, decreased over time (fig 2, top left⇓). The all cause consultation rate decreased from 323 consultations per 1000 registered patients per year in 1991 to 207 in 2012; a decrease of 35.9% (P<0.01). The change in consultation rates varied by type of infection. Rates of consultations per 1000 patients per year decreased from 152 to 86 (P<0.01) for upper respiratory tract infection, from 40 to 13 (P<0.01) for acute otitis media, and from 80 to 45 (P<0.01) for lower respiratory tract infection. The consultation rate for skin and soft tissue infections increased in a non-linear way from 51 to 63 consultations per 1000 patients per year (P<0.01).

Fig 2 Consultation rates for selected infection classes, proportion of infections in selected classes treated with antibiotic, rate of antibiotic treatment failure by infection class, and fully adjusted and indexed treatment failure rates (indexed to 1991=100, antibiotic treatment failure rates adjusted for age, sex, infection subclass, and type of antibiotic treatment used)
Rate of antibiotic prescription by infection class
Figure 2 (top right) shows the change over time in the proportion of infections in the four selected classes treated with an antibiotic. The overall percentage of consultations in which an antibiotic prescription was issued was 64.3%, with a gradual non-linear increase from 63.9% in 1991 to 65.6% in 2012, including a fall to 60.8% in 2000. The percentage of infections treated with antibiotics differed by infection class, with the greatest increase being in the smallest class, acute otitis media—from 63.2% in 1991 to 83.2% in 2012. For upper respiratory tract infections there was a decrease in the proportion treated with antibiotics, from 59.0% in 1991 to 55.0% in 2012.
Most commonly prescribed antibiotics
The most commonly prescribed antibiotics were amoxicillin (4 650 259; 42.4% of the selected infections), followed by phenoxymethylpenicillin (penicillin-V) (1 289 045; 11.8%; of which 95% were for upper respiratory tract infections) and flucloxacillin (1 214 479; 11.1%; of which 97% were for skin and soft tissue infections).
There were clear differences in the use of different antibiotics within the infection classes (fig 3⇓). Amoxicillin treatment predominated in upper and lower respiratory tract infections and acute otitis media. In 2012, 81.8% of otitis media infections treated with antibiotics received first line amoxicillin monotherapy (fig 3, bottom right). In 1991, flucloxacillin was used to treat 28.1% of skin and soft tissue infections treated with antibiotics, increasing to 54.2% in 2012 (fig 3, bottom left).

Fig 3 Ten most commonly prescribed antibiotics over observed period, by year and by selected infection
For the first and last five years of the study period the set of most commonly prescribed antibiotics for each infection class remained the same, although their relative positions changed (table 2⇓). Amoxicillin was by far the most commonly prescribed throughout.
Average prescription and antibiotic treatment failure rates (%) by infection class and by early and late time period with rank order in parentheses
For lower respiratory tract infections, the macrolide erythromycin was the second most commonly prescribed antibiotic in the first five years but was overtaken by another macrolide, clarithromycin, in the last five years (table 2).⇑ Phenoxymethylpenicillin remained the second most commonly prescribed antibiotic for upper respiratory tract infections in the first and last five years. For skin and soft tissue infections and acute otitis media alike, erythromycin was the second most common antibiotic in both periods.
Types of antibiotic treatment failure
Most (94.4%) probable antibiotic treatment failures were identified by the criterion of switching to an alternative antibiotic within 30 days of treatment. The next most commonly used criterion was referral to a specialist or specialist clinic (4.6% of failures). The proportions of treatment failures identified by each criterion remained stable over the research period.
Antibiotic treatment failure rates
The rate of change of treatment failure varied over time and was non-linear, roughly mirroring the proportion of patients with an infection who were treated with an antibiotic (fig 2⇑).
The overall antibiotic treatment failure rate for the four infection classes was 14.7%, with a non-linear increase from 13.9% in 1991 to 15.4% in 2012 (fig 2, bottom left). In 1991, the treatment failure rates were 12.0% for upper respiratory tract infections; 16.9% for lower respiratory tract infections; 12.8% for skin and soft tissue infections; and 13.9% for acute otitis media. In 2012, treatment failure rates were 12.6% for upper respiratory tract infections; 21.0% for lower respiratory tract infections; 14.5% for skin and soft tissue infections; and 12.0% for acute otitis media. For each year, the highest failure rates were seen for lower respiratory tract infections. Failure rates in acute otitis media and upper respiratory tract infections were comparable from 1999 onwards.
Within the infection classes, individual types of antibiotic were associated with markedly differing failure rates (fig 4⇓, table 2⇑). There were some notably high levels of failure; for instance, when used to treat upper respiratory tract infections (a total of 56 474 infections) trimethoprim resulted in an overall failure rate of 37.2%, increasing from 24.7% in 1991-95 to 55.9% in 2008-12. For lower respiratory tract infections, failure rates for cephalosporins increased markedly—for example, from 22.0 % in 1991-95 to 30.8% in 2008-12 for cefalexin—as did those for ciprofloxacin (from 22.3% in 1991-95 to 30.8% in 2008-12). Failure rates for flucloxacillin to treat skin and soft tissue infections did not increase, despite increased use of this antibiotic. Failure rates for macrolides across the four infection classes remained largely stable. In 2012, the antibiotics with the lowest failure rates for upper respiratory tract infections were phenoxymethylpenicillin (9.4%) and amoxicillin (12.2%); for lower respiratory tract infections, these were amoxicillin (18.8%) and clarithromycin (19.2%); for skin and soft tissue infections, lymecycline (5.8%) and oxytetracycline (7.2%); and for acute otitis media, amoxicillin (10.3%) and erythromycin (13.4%).

Fig 4 Rates of failure of antibiotic treatment over observed period by most commonly prescribed antibiotics within each infection class
Adjusted rates of failure of antibiotic treatment
After adjustment for changes over time in age, sex, infection diagnosis, and the antibiotic treatment used, there remained evidence of an overall increase in antibiotic treatment failure rates (adjusted indexed value of 112, 95% confidence interval 112 to 113; fig 2, lower right ⇑). The indexed failure rate had changed little by 2000 (99, 98 to 100), the pattern of change being more gradual and linear in the period after 2000. As in the crude failure rates (fig 2, lower left), the indexed failure rate varied by infection class: 111 (110 to 112) for upper respiratory tract infections; 135 (134 to 136) for lower respiratory tract infections; 111 (110 to 113) for skin and soft tissue infections; and 96 (94 to 99) for acute otitis media.
Discussion
Principal findings
From 1991 to 2012, more than one in 10 initial antibiotic monotherapies for four common infections were associated with treatment failure, as defined by a prespecified set of decision criteria. For upper and lower respiratory tract infection, skin and soft tissue infection, and acute otitis media, the overall failure rate increased from 13.9% to 15.4% over this period, and from 14.6% to 15.3% averaged over the earliest and latest five year periods. With 1991 as the reference year, by 2012 there was an adjusted increase in failure rates of 12% for the four classes overall. Most of the increase was from 2000, when community antibiotic prescribing, which had been falling in the second half of the 1990s, plateaued and then once again began rising.16
The rate of increase in antibiotic treatment failure was less prominent with the most commonly prescribed antibiotics and in those recommended for first line treatment, such as broad spectrum penicillins (amoxicillin) and the macrolides (clarithromycin and erythromycin). There were notable increases in failure rates for some antibiotics that are usually not recommended as first line treatments for the conditions under study, such as trimethoprim, the cephalosporins, and the quinolones. Such drugs, however, might have been prescribed for more severely ill and frail patients who had recently been prescribed a first line drug or from whom resistant organisms had been previously isolated.
Strengths and limitations of the study
The analysis of antibiotic treatment failure within primary care as a measure of effectiveness has not been attempted before on this scale. We analysed almost 11 million antibiotic monotherapy treatments for four common infection groups in research quality patients.
As the Clinical Practice Research Datalink collates data from routine practice, there are inevitably missing and erroneous data, coding imperfections, and variations in medical practice. We militated against this to some extent by applying the organisation’s data quality metrics. Of the patients excluded from the study on the basis of the research quality of their records, most (78%) were classed by the Clinical Practice Research Datalink as unacceptable on the basis of their temporary registration status, which could have resulted in the under-representation of certain disadvantaged groups with higher mobility and, possibly, greater burdens of illness. The poor quality of data associated with temporary registration, with respect to patient history and follow-up, however, made this decision necessary. The number of antibiotic treatments consequently excluded (1.7%) is unlikely to affect our findings.
Exposure to the antibiotic treatments of interest was inferred from the prescription records, which could only be considered as an intention to treat. We could not determine whether the patient actually redeemed the prescription or whether the antibiotic was taken correctly. The direct effects (as opposed to drug resistance effects) of non-compliance on the failure rates observed here would probably be to inflate the number of treatment failures identified. Any trend towards increased compliance, possibly caused by improved patient and practitioner awareness, might therefore reduce failure rates over time. We do not know whether increasing use of delayed prescribing influenced our findings.
Indications could not be determined by our algorithm for some 60% of the monotherapies, largely because the diagnostic codes associated with these monotherapies described symptoms such as cough that could not be reliably allocated to an infection class or represented conditions that fell outside our selected infection classes. This affected some antibiotics more than others; for example, 91% of metronidazole monotherapies had undeterminable indications compared with 45% of phenoxymethylpenicillin monotherapies. The sets of diagnostic codes selected to identify indications were, of necessity, limited to those in which the site and nature of the infection were clear. We believe that the missing indications should not change the overall findings as far as the most commonly used antibiotics are concerned. The appendix shows a summary of the phenotypic characteristics of those excluded.
The study’s classification of upper respiratory and skin and soft tissue infections might have been too broad for meaningful comparison, and future analysis would subdivide upper respiratory tract infection into acute sinusitis and laryngopharyngitis, the better to differentiate their pathology, and would distinguish between acne vulgaris—for which chronic repeat prescriptions are often issued—and other skin and soft tissue infections.
Antibiotic treatment failure and bacterial resistance
Our long term data characterising antibiotic treatment failure in primary care, derived from one of the few sources available to investigate such trends, showed that there was evidence of an increase in failure rates. Rates could be influenced by several factors, including changes in host factors (such as adherence to treatment, the social determinants of health, or reduced immunity associated with the older profile of the sample in more recent years), antibiotic related factors (such as changing dose and treatment duration), and pathogen related factors (such as changing virulence and antimicrobial resistance).6 The failure rates we observed might be lower than those observed in hospital care because infections in primary care are more often viral or self limiting. Signals of actual bacterial resistance might therefore not become apparent against a background of unnecessary antibiotic use. The possible underestimation underlines the necessity of making better, diagnosis guided, responsible decisions about antibiotic prescription in daily practice.
Although prescriptions are automatically recorded in the Clinical Practice Research Datalink with regard to product and quantity, precise dose instructions are not always entered explicitly. For this reason, we did not investigate treatment dose, although a preliminary exploration suggested that antibiotic doses might have increased over time. This warrants further investigation, with possible revision of the definition of antibiotic treatment failure to include dose intensification. When treatment failure increases despite higher antibiotic doses, this will be of great concern.
Implications of study
This study characterises antibiotic prescribing and treatment failure in primary care in the UK. Internationally, however, antibiotic prescribing practices in the community vary markedly. Antibiotic consumption has been most extensively characterised in the European Union, where, in 2011, this ranged from 11.4 defined daily doses per 1000 population in the Netherlands to 35.1 defined daily doses in Greece.17 The UK was ranked 17th highest of the 29 countries surveyed, with prescribing, at 18.8 defined daily doses per 1000 population, being more than 60% higher than in the Netherlands. Such variation at a country level—the product of many complex factors, including drug regulatory, educational, and cultural differences—has been correlated with resistant invasive infections in hospitals.18 The results obtained here for the UK cannot therefore be directly applied elsewhere without consideration of local factors. It remains, however, that the UK is one of few countries that has the coverage and continuity of community based data to enable a study such as this to be carried out at a patient level.
A detailed summary of the current state of antibiotic resistance throughout the world was published recently by the Lancet Infectious Diseases Commission.7 While the evidence from this commission borders on the alarming, the consensus seems to be that there is still a chance of dealing with this public health threat.
We have shown that in primary care, where most antibiotics are prescribed, and in a developed country, the impact of increasing antibiotic treatment failure was not as great as we had anticipated based on evidence reported from hospital settings with more severe infections.19 Another interpretation of these data, however, would be that failure rates have indeed increased over this period and that the observed rates are in reality higher because inappropriate or unnecessary prescribing could have attenuated the failure rates. Given the lack of new antibiotic classes on the horizon, increases in failure rates are troubling.
For the recommended first line treatment antibiotics, such as broad spectrum penicillins and the macrolides, failure rates were relatively stable over an extended period of more than 20 years, while those for other antibiotics, often not considered first line for the indications we studied, increased in some notable cases. The highest rates were seen with lower respiratory tract infections, where affected patients tended to be older and less healthy.
Conclusions
We do not know whether the increases in antibiotic treatment failure we identified represent a phenomenon that will resolve or whether this is an early indication of a more dramatic and worrying process. Nevertheless, the finding that treatment failure was associated with more than one in 10 initial antibiotic treatments in primary care represents a considerable burden on patients and on the healthcare systems. Not only should rates of antibiotic resistance continue to be monitored and acted on, trends in failure rates should also be closely scrutinised. Similar analyses should be carried out for other countries that have varying rates of antibiotic resistance to further explore the association between treatment failure and antibiotic resistance.
Our data suggest that primary care physicians could play a central role in helping to contain rises in antibiotic treatment failure by managing patients’ expectations and carefully considering whether each prescription is justified; once the decision is made to prescribe an antibiotic, the choice should follow current guidelines regarding first line drugs.
What is already known on this topic
Antibiotic resistance is associated with acute treatment failure in hospitals, resulting in considerable excess deaths and healthcare costs
Primary care clinicians and members of the general public typically regard problems associated with antibiotic resistance as hospital phenomena and largely out of their influence and control
Antibiotic prescribing in primary care is associated with antibiotic resistance at a country level, but the frequency and pattern of failure of treatment in this setting are unknown
What this paper adds
More than one in 10 initial antibiotic monotherapies for upper and lower respiratory tract and skin and soft tissue infections were associated with failure over a 22 year period in UK primary care
Overall antibiotic treatment failure rates increased from 1991 to 2012 by more than 10%, with most of the increase occurring in more recent years when antibiotic prescribing plateaued and then increased
The most commonly prescribed antibiotics were associated with relatively stable failure rates
Treatment failure rates increased in some notable cases, especially when the antibiotic selected was not considered first choice for the indications studied
Notes
Cite this as: BMJ 2014;349:g5493
Footnotes
We thank Monica S Rocha of Abbott Healthcare Products for her help with the figures and in critically reviewing the manuscript.
Contributors: CJC, CDP, and MO developed the study protocol. Data extraction and analysis were carried out by EB and SJJ, supervised by CJC. CDP created the Read code lists. CCB advised on the study question, analysis plan, and interpretation of the study findings, and contributed to drafting the final report. CLlM provided statistical expertise. Because of the conditions of the data licence, co-authors from the funding body did not have access to the source data from the Clinical Practice Research Datalink, though they did have access to processed data. All other authors had full access to all of the data (including statistical reports and tables) in the study. All authors contributed to, read, and approved the final manuscript, and all authors take responsibility for the integrity of the data and the accuracy of the data analysis. CJC is guarantor.
Funding: The study was funded by Abbott Healthcare Products. Co-authors from the funding body helped design the study and suggested editorial changes.
Competing interests: All authors have completed the Unified Competing Interest form at www.icmje.org/coi_disclosure.pdf (available on request from the corresponding author) and declare that CDP and CLlM are contractors of, EB and SJJ are employed by, and CJC is a director of Pharmatelligence, a research consultancy receiving funding from Abbott Healthcare Products for the submitted work and from other healthcare related organisations; HDV, MO, and SD are employed by Abbott Healthcare Products; and CCB has received a research grant in kind from Alere in support of a publically funded study of COPD and has received honorariums from Alere and the Alliance for the Prudent Use of Antibiotics for presentations on point-of-care testing and diagnostics in primary care.
Ethical approval: Studies using the Clinical Practice Research Datalink are covered by ethics approval granted by the Trent multicentre research ethics committee (ref 05/MRE04/87). This study was approved by the Clinical Practice Research Datalink’s independent scientific advisory committee on 31 October 2013, protocol No 13_168R.
Data sharing: No additional data available. The study data remain the property of the Clinical Practice Research Datalink, provided to the authors under licence.
Transparency: CJC (the manuscript’s guarantor) affirms that the manuscript is an honest, accurate, and transparent account of the study being reported; that no important aspects of the study have been omitted; and that any discrepancies from the study as planned (and, if relevant, registered) have been explained.
This is an Open Access article distributed in accordance with the Creative Commons Attribution Non Commercial (CC BY-NC 3.0) license, which permits others to distribute, remix, adapt, build upon this work non-commercially, and license their derivative works on different terms, provided the original work is properly cited and the use is non-commercial. See: http://creativecommons.org/licenses/by-nc/3.0/.