


Abstract
Background. The Consultation and Relational Empathy (CARE) Measure has been developed as a tool for assessing the patients' perceptions of relational empathy in the consultation.
Objectives. The present paper provides performance data on the CARE measure in a large sample of general practice consultations in areas of high and low deprivation.
Methods. The CARE Measure was included in a self-completed questionnaire study involving 3044 patients attending 26 GPs in 26 different practices (16 in areas of high socio-economic deprivation and 10 in low deprivation areas, in the west of Scotland).
Results. GPs and patients, in both high and low deprivation settings, endorsed the relevance of the CARE Measure. Overall, 76% of patients rated the measure as being 'very important' to their current consultation. Higher rating of importance were observed in older patients, patients consulting with psycho-social problems, patients with long-standing illness or disability, and patients with significant emotional distress. Few patients rated individual CARE Measure items as being 'not applicable' to their current consultation; only 3.1% of patients felt that more than 2 of the 10 items in the measure did not apply to their current consultation. Mean values were not influenced by deprivation, gender, reason for consulting, chronic illness, or emotional distress. Correlational analysis indicated that a sample size of 50 patients is sufficient to reliably estimate mean CARE score for an individual GP.
Conclusions. These results indicate that the CARE Measure is considered by GPs and patients alike as being of direct relevance to everyday consultations in general practice, in both high and low deprivation settings. The measures is stable across patient groups and a reliable estimate of perceived GP empathy requires 50 completed questionnaires per doctor.
Mercer SW, McConnachie A, Maxwell M, Heaney D and Watt GCM. Relevance and practical use of the Consultation and Relational Empathy (CARE) Measure in general practice. Family Practice 2005; 22: 328–334.
Introduction
The Consultation and Relational Empathy (CARE) Measure has been developed as a process measure of the consultation, based on a broad definition of empathy.1,2 Empathy in this clinical context has been described as the ability to communicate an understanding of a patient's world and to act on that understanding in a therapeutic way.1,3,4 The aim of developing the CARE measure is to provide a tool for the evaluation of the quality of consultations in terms of the 'human' aspects of medical care. By basing the measure on process rather than outcome, it provides doctors with direct feedback of their relational empathy, as perceived by their patients. For this reason, it has utility not only in research, but also as a tool for self-audit and has recently been accredited for use in GP appraisal and in Scotland.5
An important consideration in designing a new measure is to ensure that its construct accurately reflects the views of patients in all sectors of the community. For example, there is a dearth of research on the consultation in areas of high deprivation in the UK—despite the well known inequalities that exist in health and healthcare6—but important work by McKinstry suggests that social class may influence patients' preferences of consultation style.7 The wording of the CARE measure has been carefully developed to produce a measure that is meaningful to patients across the socio-economic spectrum.1,2 The theoretical considerations regarding empathy in the clinical context and the development of the CARE Measure have been discussed previously,1 and we have also reported the qualitative and quantitative development, and preliminary validation of the measure.2,8 We now describe the relevance and practical use of the measure in routine general practice, in over 3000 consultations in areas of high and low socio-economic deprivation in the west of Scotland.
Methods
Context
In the present paper we report data on the relevance and performance of the CARE Measure in the West of Scotland Enablement Study. This study comprised a patient-completed, anonymous 6-page questionnaire collecting a range of details including aspects of the organisation of care, perceived needs, perceived process, and outcome of consultations with the participating GPs. These overall findings will be reported in a separate paper.
Sampling frame
A database containing the mean deprivation scores measured by the Arbuthnott index9 of all GP practices in the west of Scotland was made available by the Information and Statistics Division of NHS Scotland. This index is considered to be the most accurate postcode sector measure of the factors that influence healthcare needs in Scotland, and is based on mortality rates below the age of 65 years, unemployment rates, percentage of elderly claiming income support, and percentage of households with two or more indicators of deprivation.9 Deprivation data was extracted on practices in 4 health board regions in the west of Scotland; Greater Glasgow, Argyll and Clyde, Lanarkshire, and Ayr and Arran. Ethical approval for the study was obtained from each of the 4 health boards. The 'low deprivation' group of practices invited to participate in the study were selected from practices in the lower quartile of deprivation scores for the 4 regions combined. In the high deprivation groupings, practices were selected from those in the lower quartile of the combined deprivation scores of practices in the three health board regions out-with Greater Glasgow, and those in the lower quartile of deprivation scores within Greater Glasgow. This was necessary because of the concentration of severe deprivation within Greater Glasgow.
Because patient enablement scores have been shown to be influenced by practice size10 the sampling frame was limited to medium-sized practices (3–4 partners). Only non-training practices (i.e., those that are not accredited for training GP Registrars) were included. Practices meeting these criteria were contacted by post with details of the study, and asked to nominate 1 GP to participate. This strategy was used to minimise possible cluster effects, given that the size of the study was limited by time and financial constraints. 26 GPs from 26 practices agreed to participate in the study, from 70 eligible practices approached across the 4 health board areas, giving an overall recruitment rate of 37% (36% in the high deprivation groups and 38% in the low deprivation groups). The mean deprivation scores of the eligible practices, the participating practices, and the patients who participated is shown in Table 1.
The mean deprivation scores of the eligible practices, the participating practices, and the patients who participated
| High deprivation: Greater Glasgow | High deprivation: rest of west of Scotland | Low deprivation (GG + WOS) | |
|---|---|---|---|
| All eligible practices | 7.7 (range 6.4 to 10.5) | 2.9 (range 2.0 to 7.4) | −2.4 (range −0.03 to −4.9) |
| Participating practices | 7.8 (range 6.4 to 9.1) | 2.7 (range 2.0 to 3.3) | −2.0 (range −0.03 to −4.4) |
| Participating patients | 7.6 | 2.7 | −1.8 |
The mean practice list size of the two groupings were 5118 patients in the high deprivation group and 5090 in the low deprivation group. The characteristics of the participating GPs did not differ significantly between high and low deprivation groups in terms of age and documented workload (number of sessions per week, number of patients seen per week, hours per week spent consulting, length of booked consultations, and number of house visits per week; results not shown). There were relatively more female GPs in the high deprivation group (9/16; 56%) than in the low deprivation group (4/10; 40%).
Patients
Consecutive patients of the participating GPs were asked by the reception staff if they would be willing to complete a questionnaire when they arrived for their consultations. At the end of the ten CARE Measure items, the questionnaire asked 'For the problem(s) you were seeing the doctor about today, are the doctors' attitudes and skills listed above important to you?' Respondents were invited to tick one of four responses: 'not important', 'of minor importance', 'moderately important', and 'very important'. At the end of the study period, the participating GPs were asked to self-rate themselves on the ten CARE Measure item (without knowing their patient's views) and also rate the importance of the items as above in response to the question 'Are the attitudes and skills listed above important to you as a doctor?'
The patient response rate to the questionnaire overall was 70%, (70% high deprivation group, 71% low deprivation group). Although data was not collected on the 30% of consulting patients who chose not to participate in the study, we examined the distribution of participating patients per practice, as a percentage of the distribution of deprivation (in quartiles) of all patients registered with that practice. The mean distributions of participating patients across the quartiles (least deprived to most deprived) were 3.1%, 2.3%, 1.6%, and 2.4% for Greater Glasgow high deprivation practices; 4.5%, 2.1%, 2.6% and 2.1% for rest of the west of Scotland high deprivation practices; and 1.6%, 1.7%, 2.4% and 3.0% for the low deprivation practices (Greater Glasgow and west of Scotland combined). Thus there was a reasonably equitable spread of deprivation scores of participating patients, suggesting that the patients who declined to participate were not substantially skewed towards the most deprived end of the spectrum.
For the purpose of this paper we have combined the groups into a single 'low deprivation' group and a single 'high deprivation' group.
Data Analysis
Differences between groups were assessed by non-parametric statistical tests (Kruskal-Wallis for multi-group comparisons, and Mann–Whitney for comparisons between two groups).
Results
Relevance of the CARE Measure in routine consultations
Overall, 76% of patients felt that the items contained in the CARE Measure were of major importance to their current consultation. Table 2 shows the breakdown of patients' views on the importance of empathy (as measured by the CARE Measure) according to age, gender, reason for consulting, whether or not the patient has a long-standing illness or disability, whether or not the patient has significant psychological distress (as measured by the General Health Questionnaire), and deprivation group. Gender and deprivation group had no significant influence on the perceived importance of empathy (P < 0.05), but all other groups (i.e. age, nature of problem, disability, GHQ-caseness) showed significant differences regarding the importance of empathy (P < 0.001). There were no significant differences in any of these groups between high and low deprivation settings (results not shown). Similar to the views expressed by patients, 78% of the participating GPs felt that the items in the CARE Measure were of major importance (80% of the GPs in the high deprivation areas and 76% of the GPs in the low deprivation areas).
Patients' views on the importance of empathy in the consultation
| Patient's views on the importance of empathy in the current consultation | ||||||
|---|---|---|---|---|---|---|
| Not important/minor importance | Moderately important | Very important | ||||
| Age group | ||||||
| 13–29 years | 45 (8%) | 176 (33%) | 318 (59%) | |||
| 30–44 years | 38 (5%) | 184 (22%) | 602 (73%) | |||
| 45–65 years | 19 (2%) | 87 (11%) | 681 (87%) | |||
| Over 65 years | 9 (1%) | 94 (15%) | 526 (84%) | |||
| Gender | ||||||
| Male | 37 (4%) | 172 (19%) | 716 (77%) | |||
| Female | 70 (4%) | 327 (20%) | 1270 (76%) | |||
| Nature of Problem | ||||||
| Physical | 65 (4%) | 358 (20%) | 1360 (76%) | |||
| Psychosocial | 9 (3%) | 65 (18%) | 282 (79%) | |||
| Physical and psychosocial | 9 (3%) | 40 (14%) | 246 (83%) | |||
| Long standing illness or disability | ||||||
| Yes | 43 (3%) | 197 (15%) | 1105 (82%) | |||
| No | 67 (5%) | 326 (24%) | 987 (71%) | |||
| GHQ caseness | ||||||
| Yes | 35 (4%) | 136 (16%) | 704 (80%) | |||
| No | 61 (4%) | 335 (22%) | 1125 (74%) | |||
| Deprivation group | ||||||
| High | 71 (4%) | 348 (20%) | 1350 (76%) | |||
| Low | 40 (4%) | 195 (19%) | 777 (77%) | |||
Results are given an n and (%).
In addition to testing the overall relevance of the CARE Measure, the patients' endorsement (or otherwise) of each individual CARE Measure item was also examined. This was possible by analysis of the number of patients choosing the 'not applicable' option of the questionnaire. Figure 1 shows the frequency of the 'not applicable' responses chosen by patients. For items 1–8 the number of 'not applicable' responses was extremely low (in both socio-economic settings), ranging from 0.7% to 3.2% of the sample. Items 9 and 10 however had higher numbers of not applicable responses in both socio-economic groups (10.8% to 14.9%).
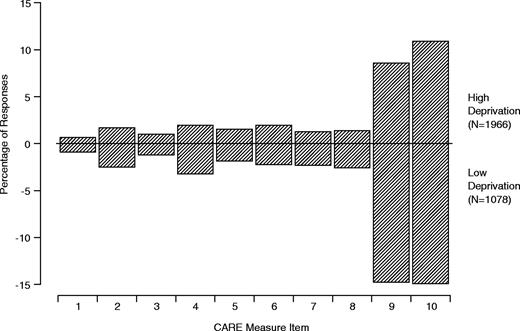
Percentages of 'Not Applicable' responses to each CARE measure item made by patients attending high and low deprivation practices
In terms of the total number of 'not applicable' responses per CARE Measure, most patients who gave a 'not applicable' response did so for only one (7.0%) or two (6.1%) of the ten items, with only 3.1% giving more than two 'not applicable' responses. Similar patterns of 'not applicable' responses were observed for the high deprivation and low deprivation areas (results not shown).
Practical use of the CARE Measure
Calculating an overall score. Calculating mean CARE measure score by including only those questionnaires which had no missing values or 'not applicable' responses gave an overall mean score of 40.8 (SD 8.9, n = 2280) with a median of 41.0 (range 10–50). However, this criteria excluded some 25% of respondents (2280 included responses out of 3044 patients). As the majority of 'not applicable' or missing responses were limited to one or two items per questionnaire we re-calculated the mean score to include questionnaires containing up to 2 'not applicable' responses or missing values (or one of each). This decreased the percentage of excluded respondents to from 25% to 10% (2734 included responses) without influencing the measures of central tendency (mean 40.8, SD 8.8, median 41). A third method of estimation was to express the results as a mean item score (multiplied by 10), thus including every questionnaire that had at least one valid response other than 'not applicable' (i.e. only questionnaires containing 10 missing or 'not applicable' responses excluded). This decreased the percentage of excluded respondents down to 6% (2985 included responses) with a mean of 40.9 (SD 8.8), median 41.0. There were no differences between the mean or median scores of the high and low deprivation groups, irrespective of the inclusion criteria used (results not shown).
Mean CARE Measure scores across different patient groups. Table 3 shows the mean CARE Measures score (calculated from the mean item score as explained above) across different patient groups (age, gender, reason for consulting, whether the patient has a long-standing illness or disability, whether the patient has GHQ-caseness, and deprivation group). There were no significant differences between groups in terms of gender, reason for consulting, long-standing illness, GHQ-caseness, or deprivation group (P < 0.05). There was however a significant age effect, with younger patients perceiving the GPs as having less empathy (P < 0.001). There were no significant differences between any of the groups between high and low deprivation settings (results not shown).
Mean CARE Measures scores across different patient groups
| Mean score | Standard deviation | Sample size | ||||
|---|---|---|---|---|---|---|
| Age group | ||||||
| 13–29 years | 39.2 | 9.4 | 557 | |||
| 30–44 years | 40.0 | 9.3 | 845 | |||
| 45–65 years | 41.8 | 8.1 | 802 | |||
| Over 65 years | 42.3 | 8.8 | 656 | |||
| Gender | ||||||
| Male | 41.0 | 8.5 | 958 | |||
| Female | 40.7 | 9.0 | 1708 | |||
| Nature of Problem | ||||||
| Physical | 40.9 | 8.6 | 1820 | |||
| Psychosocial | 41.3 | 9.0 | 372 | |||
| Physical and psychosocial | 41.1 | 9.1 | 304 | |||
| Long standing illness or disability | ||||||
| Yes | 41.2 | 8.8 | 1379 | |||
| No | 40.6 | 8.9 | 1417 | |||
| GHQ caseness | ||||||
| Yes | 41.3 | 9.0 | 894 | |||
| No | 40.6 | 8.7 | 1553 | |||
| Deprivation group | ||||||
| High | 40.8 | 9.0 | 1832 | |||
| Low | 40.9 | 8.6 | 2865 | |||
Sample size required per GP for a reliable estimate of CARE Measure score
A random effects model applied to the CARE Measure data gives
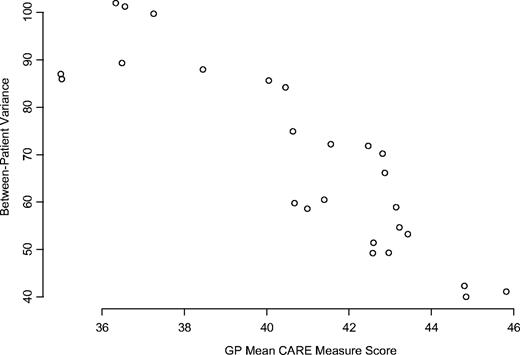
Association of between-patient variance of CARE measure scores with each GP's mean CARE measure score
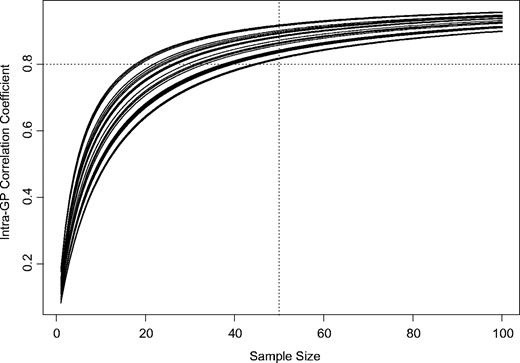
Relationships between the intra-GP correlation coefficient and sample size for each GP, based on the estimated between-GP variance and observed within-GP variances of CARE measure scores. Horizontal and vertical lines indicate that with a sample of 50 patients, a GP is likely to obtain a reliable estimate of their mean CARE measure score (correlation >0.8)
Interpretation of individual GPs' mean score. Figure 4 shows the GPs' mean CARE measure scores with 95% confidence intervals based on the observed within-GP variances, assuming samples of 50 patients per GP. Any GP with mean score ≤38 can be considered to be significantly below average and any GP with a mean score ≥43 can be considered as significantly above average. Of the 26 GPs in the present study, 6 are ≤38, 14 are 38–43, and 6 are ≥43; i.e. the cutoffs of 38 and 43 identify (approximately) the top and bottom 25% of the distribution.
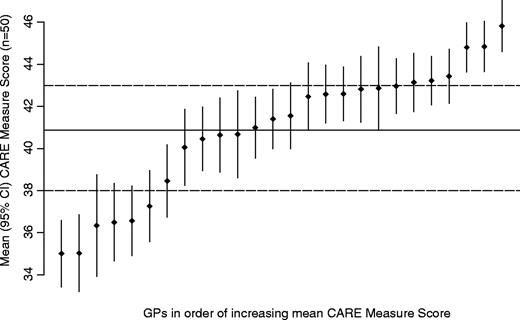
GP mean CARE measure scores with 95% confidence intervals based on the observed within-GP variances, assuming samples of 50 patients per GP. Solid line indicates average score amongst these GPs. Dashed lines demonstrate that GPs with mean scores above 43 or below 38 over a sample of 50 patients can be confident that their mean scores are above or below average
Discussion
The present paper has presented an analysis of the relevance and practical use of the CARE Measure in general practice based on a robust sample size. A major strength of the study is that it included practices and patients from areas of very high socio-economic deprivation, as well as in more affluent areas, yet with good response rates and representative participation. An important outcome of the present study is the demonstration that rigorous research on the consultation in areas of high deprivation can be done.
The analysis indicates that the CARE Measure items are considered to be highly relevant to everyday consultations by the GPs who took part in the study, with 4 out of 5 rating the measure 'of major importance'. Clearly the views of the 26 GPs who participated in the present study cannot be taken as being characteristic of all GPs in Scotland. However, in a national survey all GP Partners in Scotland, with a response rate of 62%, almost three-quarters of GPs (74.2%) felt that closeness, compassion or empathy with patients were prerequisites for good holistic care, with only 1 in 20 disagreeing with this view (H Hasegawa, pers. comm.).
The importance of empathy in the consultation from the patients' perspective is also endorsed by the current study. Overall, 3 out 4 patients felt that empathy was of major importance to their consultation, with no difference between high or low deprivation settings. As might be expected, empathy was considered least relevant by younger patients, though almost 6 out of 10 patients under 30 years of age still regarded it as very important. Patients consulting with psycho-social problems, with significant psychological distress and/or with chronic illness/disability, particularly valued relational empathy in their consultation. Empathy is considered to be a key component of therapeutic relationships,3,4 and would be predicted to be an important aspect of meaningful, continuing care for patients with chronic or complex problems. Indeed empathy has been shown to be a strong predictor of outcome in patients with mental health problems12 and our preliminary work in other settings suggests CARE Measure score is predictive of enablement13 and health changes over the subsequent 3 months across a range of chronic medical conditions.8
This relevance of the CARE Measure is also supported by the fact that very few patients (whether from high or low deprivation areas) regarded the items as 'not applicable' to their current consultation. Since the response rate of the survey was high, and the patients who participated appear to be representative of the patient populations in the high and low deprivation settings, we can have some confidence that the measure does indeed have a high face validity across the socio-economic spectrum.
In terms of practical use of the CARE measure, it has been suggested previously that scoring should include up to two not applicable values per measure.5 The present study confirms that this strategy is acceptable, and reduces the number of excluded questionnaires to a reasonably low level. However, in situations where maximal sample size is required, then the calculation of the measure on the basis of average item scores (and including questionnaires with one or more valid responses) may be a suitable alternative, given that this method of scoring produced results that were virtually identical to the former method.
The finding that mean CARE Measure scores did not vary across patient groups, in terms of gender, reason for consulting, chronic illness, GHQ-caseness, or deprivation group supports the validity of using the tool in differing settings. The influence of age was expected, as patient satisfaction questionnaires consistently report similar age effects.11,14
Clearly it is important to establish if the CARE Measure captures a concept which is distinct from other measures of consultation quality currently in use in general practice, such as the patient enablement instrument.10 Our previous work in general practice found a modest correlation between the CARE Measure and the patient enablement instrument (r = 0.3)1 and other work using a different empathy measure found a similar correlation with the enablement instrument (r = 0.4).13 The correlation of the CARE Measure with other empathy measures is much higher (r = 0.8)2 thus supporting its divergent and convergent validity and suggesting it does represent something more specific than patients' general feeling towards a consultation. However, a detailed factor analysis of the relationship between the CARE Measure and other measures of the consultation will be reported in a future paper.
Finally, the present study has demonstrated that a sample of 50 valid CARE measures will give a representative score per GP. Our suggestions on what constitutes an 'average', 'above average' or 'below average' score should be treated with caution, as we can only base this on the results gathered on the 26 GPs in a defined geographic area, from medium sized, non-training practices, who volunteered to participate in the present study. However, as we gather more data on the measure from appraisal and future research, these guidelines will be updated.
In conclusion, the present study indicates that the CARE Measure is considered by most GPs and by most patients as being of high relevance to everyday consultations in general practice in both high and low deprivation settings. A reliable estimate of perceived GP empathy requires a minimum of 50 completed questionnaires per doctor.
Declaration
Funding: SWM was supported by a Health Services Research Training Fellowship from the Chief Scientist Office of the Scottish Executive at the time of the original study, and is currently supported by a Primary Care Research Career Award from the same organisation.
Ethical approval: ethical approval for the study was obtained from each of the 4 health boards.
Conflicts of interest: none.
References
Mercer SW, Watt GCM, Maxwell M, Heaney DH. The development and preliminary validation of the consultation and Relational Empathy (CARE) Measure: an empathy-based consultation process measure.
Reynolds W, Scott B. Empathy: a crucial component of the helping relationship.
Reynolds W. The Measurement and Development of Empathy in Nursing. Aldershot: Ashgate Publishing;
Royal College of General Practitioners (Scotland). Revalidation toolkit for doctors working in clinical general practice in Scotland. RCGP Scotland 2003. http://www.rcgp-scotland.org.uk
McKinstry B. Do patients wish to be involved in decision making in the consultation? A cross-sectional survey with video vignettes.
Bikker AP, Mercer SW, Reilly D. Predictive validity of the CARE Measure at the Glasgow Homoeopathic Hospital (abstract).
Scottish Executive Health Department. Fair shares for all. Report of the National Review of Resource Allocation for the NHS in Scotland. Edinburgh: HMSO;
Howie JGR, Heaney DJ, Maxwell M, Walker JJ, Freeman GK, Rai H. Quality at general practice consultations: cross-sectional survey.
Streiner DL, Norman GR. Health measurement scales (third edition). Oxford: Oxford University Press;
Horvath AO and Greenberg LS. The working alliance; theory, research and practice. New York: John Wiley and Sons;
Mercer SW, Reilly D, Watt GCM. The importance of empathy in the enablement of patients attending the Glasgow Homoeopathic Hospital.
Author notes
aGeneral Practice and Primary Care, Division of Community-based Sciences, University of Glasgow, 1 Horeselethill Road, Glasgow G12 9LX, bRobertson Centre for Biostatistics, Boyd Orr Building, University of Glasgow, Glasgow G12 8QQ and cDepartment of Community Health Sciences-General Practice Section, University of Edinburgh, Edinburgh EH8 9DX, UK. dHighlands and Islands Health Research Institute, University of Aberdeen, Inverness IV2 3ED, UK
