
Article Figures & Data
Figures
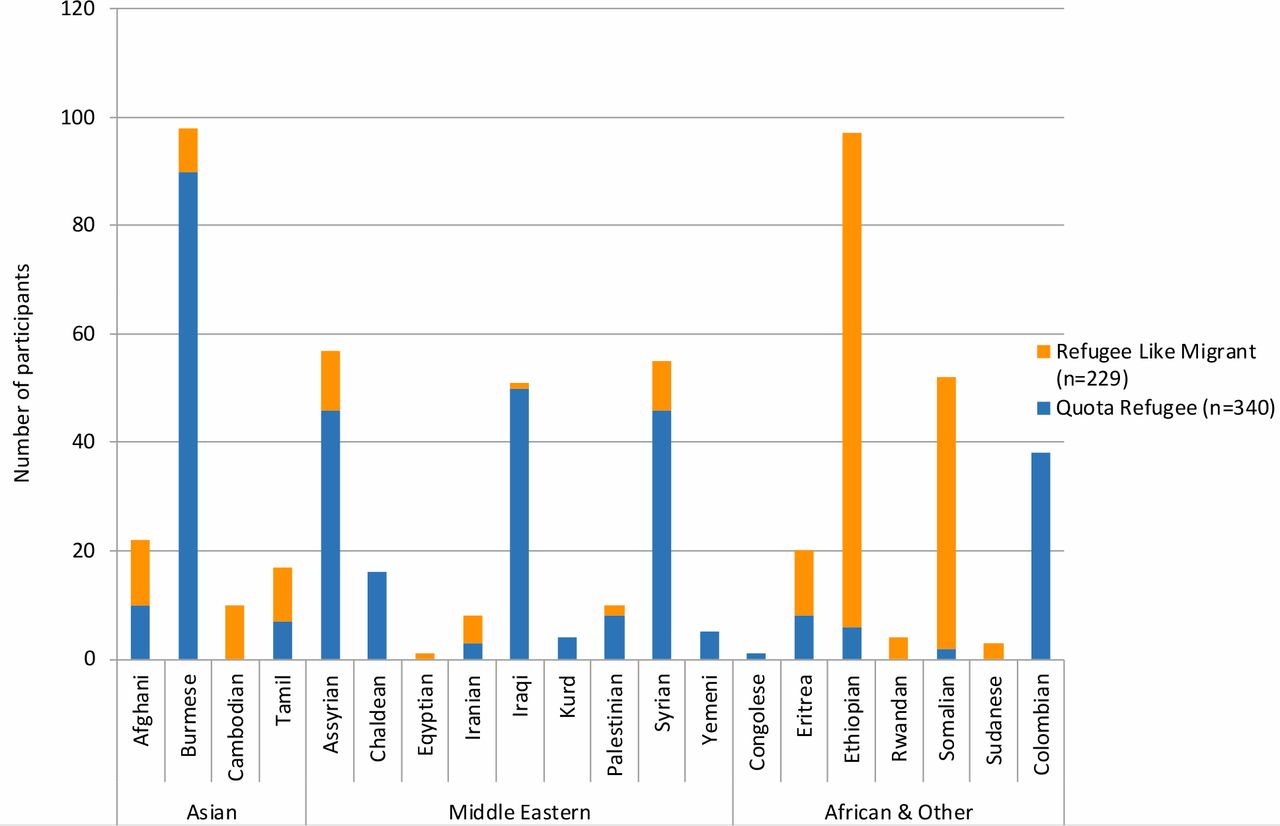
- Figure 1. Refugee-like migrants and quota refugees by self-identified ethnic group
- Figure 2. Age and sex standardised: a) GP consultations, b) primary care nurse consultations, and c) ‘encounters’, by year after arrival with 95% confidence intervals


Tables
Visa categories Healthcare entitlement Health screening and
systematic supportAnnual intake Quota refugee Granted permanent residence status in New Zealand. Eligible for fully funded health services. Offshore health screening.Six-week residential orientation and additional health screening at Mangere Refugee Resettlement Centre.22Settlement and social care support in community. 750 per annum during the period of this research, since raised to 1000 per annum in July 2018, and planned to increase further to 1500 per annum in July 2020.23Countries of origin have varied over time according to government priorities.24 Refugee-like migrant Heterogenous group with variety of New Zealand visa categories; for example, refugee family support category,23 visitor visa, or work visa categories. Variable, some are granted New Zealand permanent residence status and have access to fully funded health services, others on visitor visa or work visa for less than 2 years have no funded health or social care support. Variable offshore health screening depending on visa category.Arrive to family members in community.Additional health screening not systematically offered. Limited information. Asylum seeker (convention refugee)23 May apply for New Zealand Permanent Residence status if granted ‘refugee or protected person’ status at conclusion of asylum seeker application process. Fully funded health services while application being processed. Variable offshore health screening depending on initial visa category.Optional additional health screening funded on arrival once asylum seeker application lodged.No systematic social care or settlement support. Variation in applications, from 333 people in 2010–2011 to 510 people in 2018–2019.25 - Table 2. Sociodemographic characteristics of refugee-like migrants (n = 229) and quota refugees (n = 340) at enrolment in practice
Variable Level Quota refugee Refugee-like migrant n % (95% CI) n % (95% CI) Age group (years) 0–9 41 12.1 (8.8 to 16.0) 21 9.2 (5.8 to 13.7) 10–19 69 20.3 (16.1 to 25.0) 40 17.5% (12.8 to 23.0 20–29 50 14.7 (11.1 to 18.9) 73 31.9 (25.9 to 38.3) 30–39 74 21.8 (17.5 to 26.5) 50 21.8 (16.7 to 27.8) 40–49 61 17.9 (14.0 to 22.4) 12 5.2 (2.7 to 9.0) 50–59 23 6.8 (4.3 to 10.0) 17 7.4 (4.4 to 11.6) 60–69 12 3.5 (1.8 to 6.1) 12 5.2 (2.7 to 9.0) ≥70 10 2.9 (1.4 to 5.3) 4 1.7 (0.5 to 4.4) Median (IQR) 31 (16 to 43) 27 (19 to 36) Sex Female 166 48.8 (43.4 to 54.3) 121 52.8 (46.2 to 59.4) Male 174 51.2 (45.7 to 56.6) 108 47.2 (40.6 to 53.8) Ethnicity (grouped) Asian 107 31.5 (26.6 to 36.7) 40 17.5 (12.8 to 23.0) Middle Eastern 178 52.4 (46.9 to 57.8) 29 12.7 (8.6 to 17.7) Latin American 38 11.2 (8.0 to 15.0) 0 0.0 (0.0 to 1.3) African 17 5.0 (2.9 to 7.9) 160 69.9 (63.5 to 75.7) NZDep Quintile 1 1 0.3 (0.0 to 1.6) 5 2.2 (0.7 to 5.0) 2 28 8.2 (5.5 to 11.7) 11 4.8 (2.4 to 8.4) 3 23 6.8 (4.3 to 10.0) 33 14.4 (10.1 to 19.6) 4 96 28.2 (23.5 to 33.3) 27 11.8 (7.9 to 16.7) 5 183 53.8 (48.4 to 59.2) 151 65.9 (59.4 to 72.1) Missing 9 2.6 (1.2 to 5.0) 2 0.9 (0.1 to 3.1) Interpreter needed Yes 311 91.5 (88.0 to 94.2) 188 82.1 (76.5 to 86.8) Years of follow-up data since enrolment 0 to <1 8 2.4 9 3.9 1 to <2 101 29.7 31 13.5 2 to <3 48 14.1 58 25.3 3 to <4 74 21.8 59 25.8 4 to <5 85 25.0 30 13.1 5 to <6 24 7.1 42 18.3 Median (IQR) Median 3.2 (1.8 to 4.1) Median 3.3 (2.2 to 4.4) CI = confidence intervals. IQR = interquartile range.
- Table 3. Health utilisation, screening and immunisation by cohort adjusted for age and sex
Group Variable Unit Quota refugee Refugee-like migrant Crude rate Adjusted rate with 95% CI Crude rate Adjusted rate with 95% CI Adjusted relative risk RLM:QR with 95% CI Primary c are u tilisation GP consultations Rate per 100 person-years in study 256.1 278.7 (265.8 to 293.6) 225.6 255.9 (238.4 to 276.5) 0.92 (0.84 to 1) Primary care nurse consultations Rate per 100 person-years in study 223.2 247 (234.6 to 261.3) 263.4 296.7 (276.4 to 320.1) 1.2 (1.1 to 1.31) Primary care social worker consultations Rate per 100 person-years in study 18.0 23.7 (20.4 to 29.7) 60.8 42.3 (37.1 to 51.2) 1.78 (1.47 to 2.16) Encounters Rate per 100 person-years in study 953.9 1035.1 (1009.3 to 1062.6) 966.2 1,057 (1019.3 to 1097.6) 1.02 (0.98 to 1.07) Visits to other primary care providers including after-hours Rate per 100 person-years in study 14.4 15.5 (12.7 to 21) 10.0 15.7 (10.3 to 25.6) 1.01 (0.66 to 1.55) Secondary c are u tilisation Emergency department visits Rate per 100 person-years in study 37.2 40 (34.4 to 48.1) 26.3 36.7 (28.7 to 48.7) 0.92 (0.7 to 1.21) Inpatient admissions Rate per 100 person-years in study 29.8 34.1 (28.7 to 41.9) 24.4 30.4 (23.6 to 41.1) 0.89 (0.67 to 1.19) All outpatient visits Rate per 100 person-years in study 254.0 300.6 (283.8 to 319.3) 168.5 208.0 (191.6 to 227.6) 0.69 (0.63 to 0.76) Outpatient dental visits Rate per 100 person-years in study 40.5 48.7 (43.3 to 56.5) 22.5 22.3 (18.4 to 30.3) 0.46 (0.37 to 0.57) Outpatient allied health Rate per 100 person-years in study 39.6 41.8 (37.3 to 48.8) 28.7 43.5 (36.6 to 54) 1.04 (0.85 to 1.27) Outpatient maternity Rate per 100 person-years in study 75.0 75.5 (65.7 to 86.7) 85.1 89.3 (78.3 to 103.3) 1.18 (0.98 to 1.43) Maternity deliveries Rate per 100 person-years in study 6.1 6.7 (3.9 to 11.2) 6.7 5.9 (3.5 to 12.5) 0.88 (0.45 to 1.74) Mental health care liaison Rate per 100 person-years in study 57.4 54.1 (49.2 to 61.2) 32.0 18.9 (16.3 to 25.9) 0.35 (0.3 to 0.41) Screening Blood Percentage of cohort 86.5 86.9 (75.8 to 100.0) 79.0 78 (64.2 to 100.0) 0.9 (0.71 to 1.13) Stool Percentage of cohort 95.3 95.9 (84.1 to 100.0) 81.7 83 (67.2 to 100.0) 0.87 (0.68 to 1.1) Tuberculosis Percentage of cohort 87.9 89.2 (77.8 to 100.0) 57.6 58.1 (44.8 to 80.5) 0.65 (0.49 to 0.86) Cervixa Percentage of cohort 94.9 94 (74.4 to 100.0) 68.5 73.1 (52 to 100.0) 0.78 (0.53 to 1.14) Breasta Percentage of cohort 37.9 45.8 (21.9 to 87.8) 36.8 29.2 (11.3 to 83.2) 0.64 (0.24 to 1.71) Immunisation Number (percentage) with at least one immunisation consultation Percentage of cohort 80.6 81.9 (70.9 to 95.5) 80.3 83.3 (67.1 to 100.0) 1.02 (0.79 to 1.30) Days until first immunisation consultation for those immunised Median 39.4 95.0 Number of immunisation consultations for those immunised Mean 2.5 2.5 (2.3 to 3.8) 3.5 3.3 (3.0 to 3.7) 1.30 (1.14 to 1.49) CI = confidence intervals. RLM:QR = refugee-like migrant: quota refugee.
a Screening rates for breast screening, and cervical screening offered, calculated for eligible women aged 45–69 years and 20–69 years respectively.
For percentages, confidence interval upper limits that exceeded 100% are printed as 100% in the table (as age/sex standardisation uses a rate-based method with no upper limit).
In this issue
Refugee-like migrants have similar health needs to refugees: a New Zealand post-settlement cohort study


Jump to section
More in this TOC Section
Related Articles
Cited By...
Intended for Healthcare Professionals
