
Article Figures & Data
Figures
- Figure 1. Flow diagram of study participants. NSAID = non-steroidal anti-inflammatory drug.
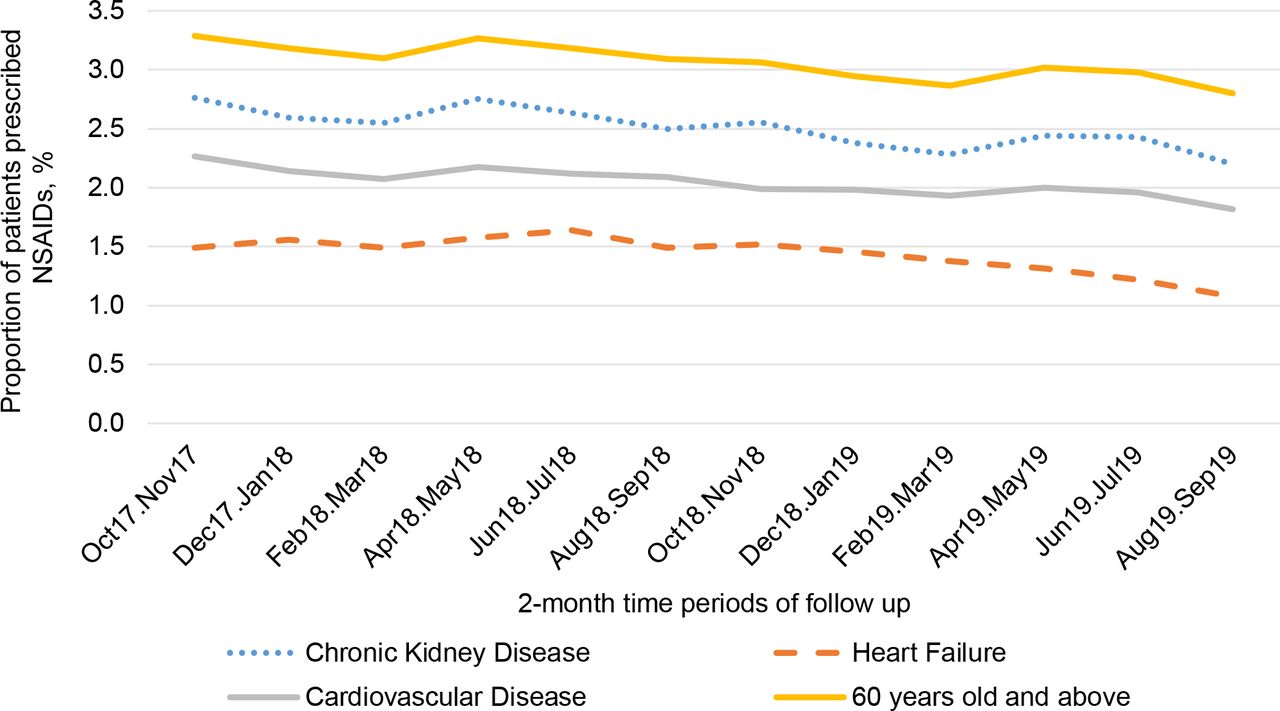
- Figure 2. Proportion of patients in each of the risk groups prescribed NSAIDs in each 2-month time period of follow up
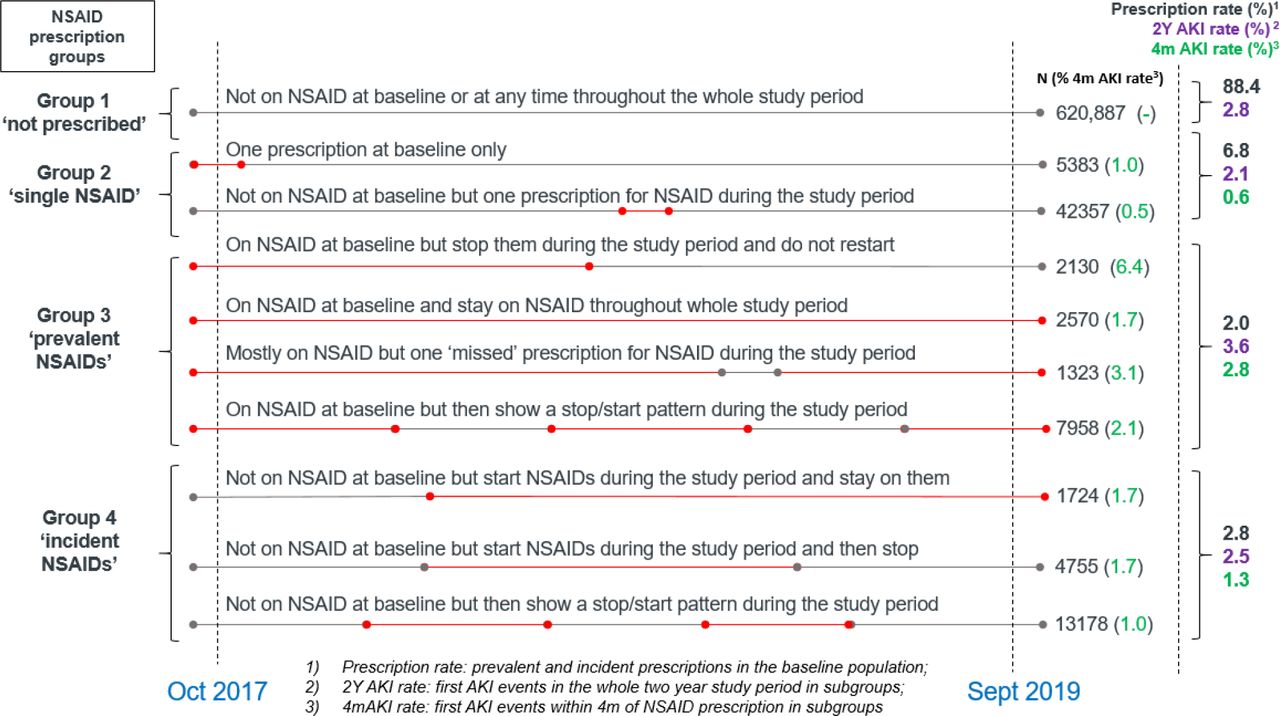
- Figure 3. Non-steroidal anti-inflammatory drug (NSAID) prescription patterns throughout the study period. AKI = acute kidney injury. M = month. Y = year.


Tables
Characteristic n %a Age, years Median (IQR) 52 36–66 Mean (SD) 52 19 Age group, years 18–39 210 047 29.9 40–59 241 831 34.4 60–79 194 168 27.6 ≥80 56 219 8.0 Sex Male 328 712 46.8 Female 373 553 53.2 Socioeconomic status (IMD quintile) 1 (most deprived) 102 796 14.6 2 126 069 18.0 3 132 262 18.8 4 146 622 20.9 5 (least deprived) 186 284 26.5 Missing 8232 1.2 Ethnic group British and Mixed British (Irish, Other, or White) 427 019 60.8 Mixed (White and Asian, White and Black African, White and Black Caribbean, or Other Mixed) 3863 0.6 Indian, Bangladeshi, Pakistani, or Other Asian 13 180 1.9 African, Caribbean, or Other Black 5251 0.7 Other 7236 1.0 Missing 245 716 35.0 Long-term condition diagnosed at the point of baseline Chronic kidney disease 36 059 5.1 CVD (ischaemic heart disease, cerebrovascular disease, and peripheral cardiovascular disease) 52 985 7.5 Heart failure 12 799 1.8 Diabetes 62 767 8.9 Hypertension 150 458 21.4 Osteoarthritis 95 294 13.6 Rheumatoid arthritis 6723 1.0 Prescribed at baseline NSAID 19 364 2.8 aUnless otherwise stated. CVD = cardiovascular disease. CVD = cardiovascular disease. IQR = interquartile range. IMD = Index of Multiple Deprivation. NSAID = non-steroidal anti-inflammatory drug. SD = standard deviation.
Characteristic Odds ratioa 95% CI P-value Age group, years (versus 18–40) 40–59 2.20 2.11 2.29 0.02 60–79 2.59 2.48 2.71 <0.001 ≥80 1.29 1.20 1.39 <0.001 Sex (versus male) Female 1.22 1.19 1.26 <0.001 Socioeconomic status, IMD quintile (versus 5, least deprived) 4 1.06 1.01 1.10 <0.001 3 1.15 1.10 1.20 <0.001 2 1.29 1.23 1.35 <0.001 1 (most deprived) 1.54 1.47 1.61 <0.001 CKD (versus no CKD) 1.00 0.94 1.06 0.96 CVD (versus no CVD) 0.80 0.76 0.85 <0.001 Heart failure (versus no heart failure) 0.51 0.44 0.59 <0.001 Diabetes (type 1 or 2 versus no diabetes) 1.31 1.26 1.37 <0.001 Hypertension (versus no hypertension) 1.44 1.39 1.49 <0.001 Osteoarthritis (versus no osteoarthritis) 2.82 2.73 2.91 <0.001 Rheumatoid arthritis (versus no rheumatoid arthritis) 5.08 4.71 5.47 <0.001 aFor those with multiple categories odd ratios were compared with base groups. CKD = chronic kidney disease. CVD = cardiovascular disease. IMD = Index of Multiple Deprivation. NSAID = non-steroidal anti-inflammatory drug.
- Table 3. Multivariate logistic model on associations between NSAID prescription and AKI within 4 months from the start of prescription period
Characteristic Odds ratio 95% CI P-value Age group, years (versus 18–40) 40–59 1.65 1.27 2.18 <0.001 60–79 3.98 3.07 5.22 <0.001 ≥80 7.57 5.53 10.42 <0.001 Sex (versus male) Female 1.11 0.97 1.27 0.13 Socioeconomic status, IMD quintile (versus 5, least deprived) 4 1.19 0.96 1.46 0.11 3 1.29 1.04 1.59 0.02 2 1.64 1.34 2.01 <0.001 1 (most deprived) 1.69 1.36 2.09 <0.001 CKD (versus no CKD) 1.61 1.30 1.97 <0.001 CVD (versus no CVD) 1.78 1.47 2.14 <0.001 Heart failure (versus no heart failure) 1.78 1.23 2.51 0.001 Diabetes (type 1 or 2 versus no diabetes) 1.50 1.25 1.78 <0.001 Hypertension (versus no hypertension) 1.41 1.21 1.64 <0.001 Cohort: N = 77 422; AKI: n = 915. CKD = chronic kidney disease. CVD = cardiovascular disease. IMD = Index of Multiple Deprivation.
In this issue
Characterising risk of non-steroidal anti-inflammatory drug-related acute kidney injury: a retrospective cohort study


Jump to section
Keywords
More in this TOC Section
Related Articles
Cited By...
Intended for Healthcare Professionals
