
Article Figures & Data
Figures
- Figure 1. Study flowchart
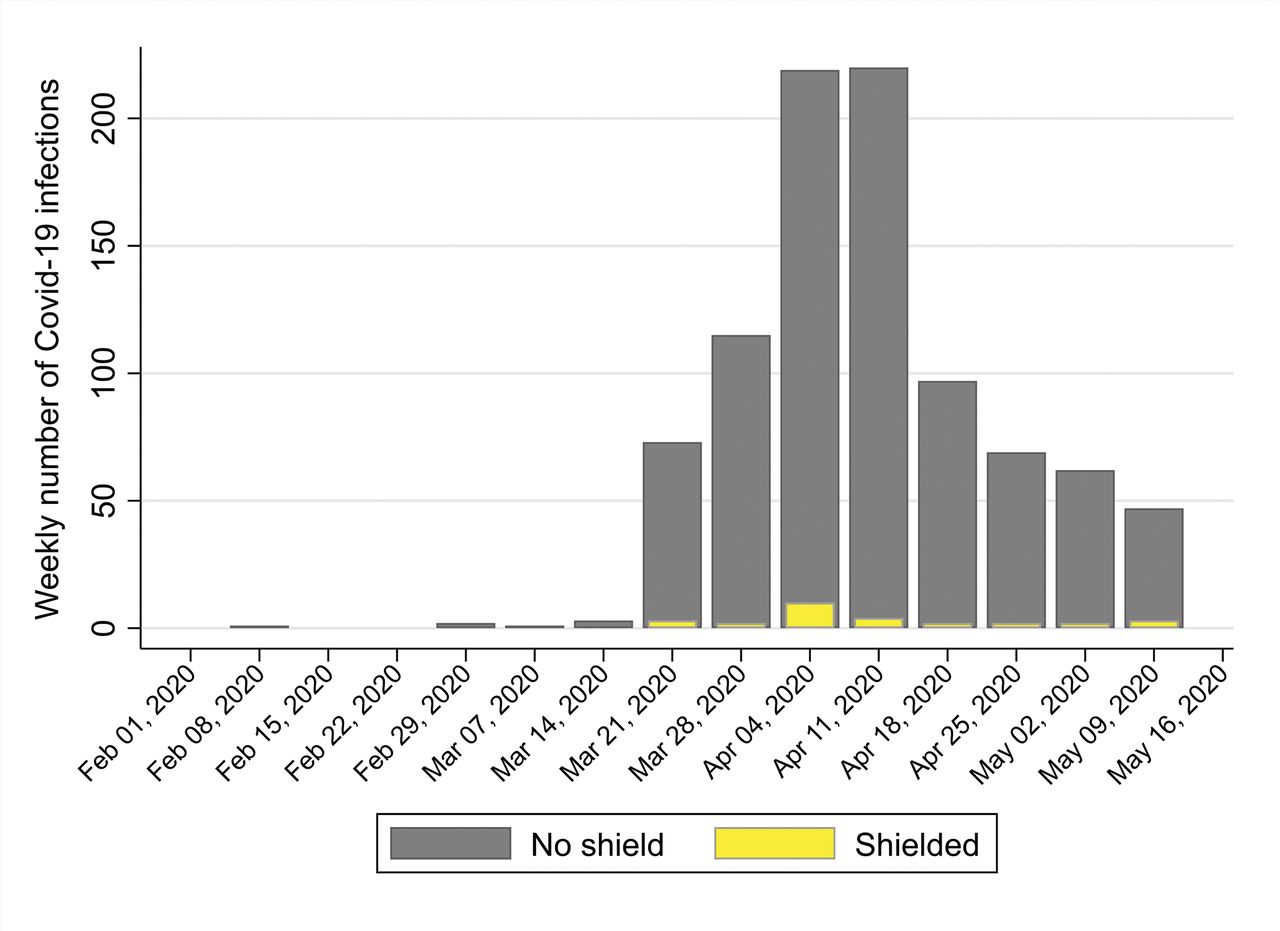
- Figure 2. Weekly cases of COVID-19 infections by shielding categories from 23 March 2020 to 15 May 2020

Tables
- Table 1. Summary characteristics of shielded (7 April 2020) and non-shielded in 57 713 adults aged ≥18 years
Variables Shieldedn = 573 Non-shieldedn = 57 140 P value n Col % n Col % COVID-19 infection 37 6.5 1037 1.8 <0.001 Sex Female 341 59.5 28 974 50.7 <0.001 Male 232 40.5 28 164 49.3 Missing 0 0 0 0 Age, years <30 32 5.6 11 512 20.2 <0.001 30–39 48 8.4 16 945 29.7 40–49 53 9.3 11 389 19.9 50–59 111 19.4 8207 14.4 60–69 118 20.6 4646 8.1 70–79 142 24.8 2848 5.0 ≥80 69 12.0 1593 2.8 Nursing home resident 8 1.4 178 0.3 <0.001 BMI (kg/m2) Underweight (<18.5 kg/m2) 26 4.1 2350 4.5 <0.001 Normal weight(18.5–24.9 kg/m2) 169 29.5 20 981 36.7 Pre-obesity(25.0–29.9 kg/m2) 122 21.3 11 074 19.4 Obese I(30.0–34.9 kg/m2) 78 13.6 3855 6.8 Obese II(35.0–39.9 kg/m2) 22 3.8 1291 2.3 Obese III(≥40 kg/m2) 17 3.0 714 1.3 Missing value 139 24.3 16 875 29.5 IMD quintile (% coded) 1 (most deprived) 145 25.3 10 945 19.2 0.009 2 107 18.7 10 935 19.1 3 114 19.9 11 565 20.2 4 95 16.6 11 297 19.8 5 (least deprived) 95 16.6 10 502 18.4 Missing 17 3.0 1896 3.3 Ethnic group White 157 27.4 18 294 32.0 <0.001 Black African 71 12.4 3537 6.2 Chinese 1 0.2 1067 1.9 Asian 34 5.9 3654 6.4 Mixed 170 29.7 16 080 28.1 Other 101 17.6 7724 13.5 Non-stated 12 2.1 727 1.3 Missing 27 4.7 6057 10.6 History of comorbidities Type 2 diabetes 112 19.6 2647 4.6 <0.001 HTN 153 26.7 4042 7.1 <0.001 CKD 91 15.9 1198 2.1 <0.001 CHD 62 10.8 973 1.7 <0.001 Respiratory disease 178 31.1 691 1.2 <0.001 Lifestyle factors Does not smoke 218 38.1 32 897 57.6 <0.001 Currently smokes 130 22.7 10 208 17.9 Formerly smoked 221 38.6 11 596 20.3 Missing 4 0.7 2439 4.3 CHD = coronary heart disease. Col = column. CKD = chronic kidney disease. HTN = hypertension. IMD = Index of Multiple Deprivation.
- Table 2. Summary characteristics of adults infected with COVID-19 compared with those not infected in 57 713 adults aged ≥18 years
COVID-19 n = 1074 (1.9%) No COVID-19 infection n = 56 639 (98.1%) P value Sex Female 651 (60.6) 28 664 (50.6) <0.001 Male 423 (39.4) 27 973 (49.4) Age, years <0.001 18–30 94 (8.8) 11 450 (20.2) 30–39 202 (18.8) 16 791 (29.7) 40–49 223 (20.8) 11 219 (19.8) 50–59 258 (24.0) 8060 (14.2) 60–69 137 (12.8) 4627 (8.2) 70–79 84 (7.8) 2906 (5.1) ≥80 76 (7.1) 1586 (2.8) Ethnic group n (%) White 251 (23.4) 18 200 (32.1) <0.001 South Asian 81 (7.5) 3607 (6.4) Black African 138 (12.9) 3470 (6.1) Chinese 11 (1.0) 1057 (1.9) Mixed 268 (25.0) 15 982 (28.2) Other 221 (20.6) 7604 (13.4) Non-stated 23 (2.1) 716 (1.3) Missing 81 (7.5) 6003 (10.6) Lifestyle indicators Nursing home resident 52 (4.8) 134 (0.2) <0.001 Not obese 794 (73.9) 44 437 (78.5) <0.001 Obese (BMI >30 kg/m2) 230 (21.4) 7112 (12.6) Missing 50 (4.7) 5090 (9.0) IMD quintile (% coded) 1 (most deprived) 241 (22.4) 10 849 (19.2) <0.001 2 233 (21.7) 10 809 (19.1) 3 219 (20.4) 11 460 (20.2) 4 176 (16.4) 11 216 (19.8) 5 (least deprived) 156 (14.5) 10 441 (18.4) Missing 49 (4.5) 1864 (3.3) Smoking status <0.001 Currently smokes 174 (16.2) 10 164 (18.0) Formerly smoked 265 (24.7) 11 552 (20.4) Does not smoke 623 (58.0) 32 492 (57.4) Missing 12 (1.1) 2431 (4.3) Comorbidities Type 2 diabetes 128 (11.9) 2631(4.7) <0.001 HTN 153 (14.3) 4042 (7.1) <0.001 CKD 57 (5.3) 1232 (2.2) <0.001 CHD 48 (4.5) 987 (1.7) <0.001 Respiratory disease 54 (5.0) 815 (1.4) <0.001 CHD = coronary heart disease. CKD = chronic kidney disease. HTN = hypertension. IMD = Index of Multiple Deprivation.
- Table 3. Partially and fully adjusted multi-level mixed effects regression of the odds of shielding status in 57 713 adults aged ≥18 years
Shielding status Partially adjusted odds ratio 95% CIa P value Fully adjusted odds ratio 95% CIb P value Age (years) 1.06 (1.05 to 1.06) <0.001 1.03 (1.03 to 1.04) <0.001 Sex Female ref ref Male 0.74 (0.63 to 0.88) <0.001 0.62 (0.52 to 0.75) <0.001 Nursing home resident 0.80 (0.39 to 1.65) 0.54 1.07 (0.35 to 3.33) 0.90 BMI BMI <30 kg/m2 ref ref Obese >30 kg/m2 1.60 (1.32 to 1.94) <0.001 1.32 (1.07 to 1.64) 0.01 Smoking status Does not smoke ref ref Currently smokes 2.45 (1.96 to 3.07) <0.001 1.50 (1.16 to 1.94) <0.001 Formerly smoked 2.16 (1.78 to 2.62) <0.001 1.68 (1.35 to 2.10) <0.001 Ethnic group White ref ref South Asian 0.98 (0.67 to 1.42) 0.91 1.37 (0.92 to 2.03) 0.12 Black African 2.23 (1.68 to 2.97) <0.001 2.78 (2.02 to 3.81) <0.001 Chinese 0.15 (0.02 to 1.07) 0.06 0.23 (0.03 to 1.64) 0.14 Mixed 1.11 (0.89 to 1.38) 0.36 1.11 (0.87 to 1.41) 0.40 Other 1.13 (0.88 to 1.46) 0.33 1.26 (0.95 to 1.67) 0.11 Non-stated 1.80 (0.99 to 3.28) 0.06 2.23 (1.16 to 4.27) 0.02 Missing 0.50 (0.33 to 0.75) 0.001 0.84 (0.54 to 1.30) 0.42 IMD quintile (% coded) 1 (least deprived) ref 2 0.94 (0.71 to 1.25) 0.68 0.98 (0.72 to 1.33) 0.90 3 1.10 (0.83 to 1.44) 0.50 1.16 (0.86 to 1.55) 0.33 4 1.09 (0.83 to 1.44) 0.53 0.97 (0.72 to 1.31) 0.85 5 (most deprived) 1.48 (1.14 to 1.92) 0.003 1.24 (0.93 to 1.64) 0.14 Comorbidities Type 2 diabetes 1.95 (1.56 to 2.45) <0.001 1.39 (1.07 to 1.80) 0.01 HTN 1.45 (1.17 to 1.79) 0.001 1.07 (0.84 to 1.36) 0.58 CKD 2.05 (1.58 to 2.67) <0.001 1.96 (1.47 to 2.63) <0.001 CHD 1.97 (1.47 to 2.63) <0.001 1.21 (0.87 to 1.68) 0.27 Respiratory disease 15.16 (12.24 to 18.76) <0.001 12.72 (10.00 to 16.18) <0.001 BMI = body mass index; IMD = Index of Multiple Deprivation; HTN = hypertension; CKD = chronic kidney disease; CHD = coronary heart disease
a Adjusted for age and sex.
b Adjusted for all covariates in the table and practice.
- Table 4. Partially and fully adjusted Cox proportional hazards regression of the odds of COVID-19; during 1 February 2020–15 May 2020 in 57 713 adults aged ≥18 years
COVID-19 infection Partially adjustedhazard ratio 95% CIa Fully adjusted hazard ratio 95% CIb Fully adjusted P value Age, years 1.03 (1.02 to 1.03) <0.001 1.02 (1.01 to 1.02) <0.001 Sex Female – – Male 0.68 (0.60 to 0.77) <0.001 0.71 (0.62 to 0.82) <0.001 Shielded group 2.00 (1.35 to 2.86) <0.001 1.52 (1.00 to 2.30) 0.048 Nursing home resident 9.37 (6.68 to 13.15) <0.001 7.05 (4.22 to 11.77) <0.001 BMI BMI <30 kg/m2 ref ref Obese >30 kg/m2 1.50 (1.29 to 1.76) <0.001 1.39 (1.18 to 1.63) <0.001 Smoking status Does not smoke ref ref Currently smokes 0.90 (0.75 to 1.08) 0.24 0.90 (0.74 to 1.09) 0.29 Formerly smoked 1.02 (0.87 to 1.19) 0.81 1.10 (0.94 to 1.30) 0.24 Ethnic group White ref ref South Asian 1.48 (1.14 to 1.93) 0.004 1.46 (1.10 to 1.93) 0.01 Black African 2.68 (2.16 to 3.34) <0.001 2.52 (1.99 to 3.18) <0.001 Chinese 0.91 (0.50 to 1.66) 0.75 1.04 (0.57 to 1.91) 0.90 Mixed 1.11 (0.92 to 1.33) 0.28 1.12 (0.93 to 1.36) 0.24 Other 1.75 (1.45 to 2.12) <0.001 1.74 (1.42 to 2.13) <0.001 Non-stated 2.10 (1.34 to 3.30) 0.001 1.70 (1.02 to 2.84) 0.04 Missing 0.88 (0.67 to 1.16) 0.36 0.87 (0.64 to 1.18) 0.37 IMD quintile (% coded) 1 (least deprived) ref ref 2 1.13 (0.90 to 1.41) 0.30 1.07 (0.85 to 1.34) 0.58 3 1.33 (1.07 to 1.64) 0.01 1.25 (1.01 to 1.56) 0.05 4 1.31 (1.05 to 1.63) 0.02 1.11 (0.88 to 1.40) 0.38 5 (most deprived) 1.46 (1.17 to 1.81) 0.001 1.21 (0.97 to 1.53) 0.10 Comorbidities Type 2 diabetes 1.63 (1.31 to 2.02) <0.001 1.26 (0.99 to 1.60) 0.06 HTN 1.25 (1.02 to 1.53) 0.03 1.01 (0.81 to 1.26) 0.93 CKD 1.00 (0.74 to 1.37) 0.98 0.79 (0.57 to 1.11) 0.17 CHD 1.38 (1.00 to 1.90) 0.01 1.20 (0.85 to 1.69) 0.29 Respiratory disease 1.68 (1.23 to 2.31) <0.001 1.51 (1.06 to 2.16) 0.02 CHD = coronary heart disease. CKD = chronic kidney disease. HTN = hypertension. IMD = Index of Multiple Deprivation.
a Adjusted for age, sex, and practice.
b Adjusted for all covariates in the table and practice.
Supplementary Data
- BJGPO.2021.0081_Supp.pdf -
Supplementary material is not copyedited or typeset, and is published as supplied by the author(s). The author(s) retain(s) responsibility for its accuracy.
In this issue


Jump to section
More in this TOC Section
Related Articles
Cited By...
